Earth.org · 2020–2022
Led the data team at Earth.org, growing organic traffic 68x in 18 months. Produced original data journalism and visualisations cited by peer-reviewed journals, US law reviews, and government agencies, entirely without outreach or link-building. Technical stack: Python for data analysis, QGIS for geospatial visualisation, Adobe Illustrator for final production.
Original research · 2025
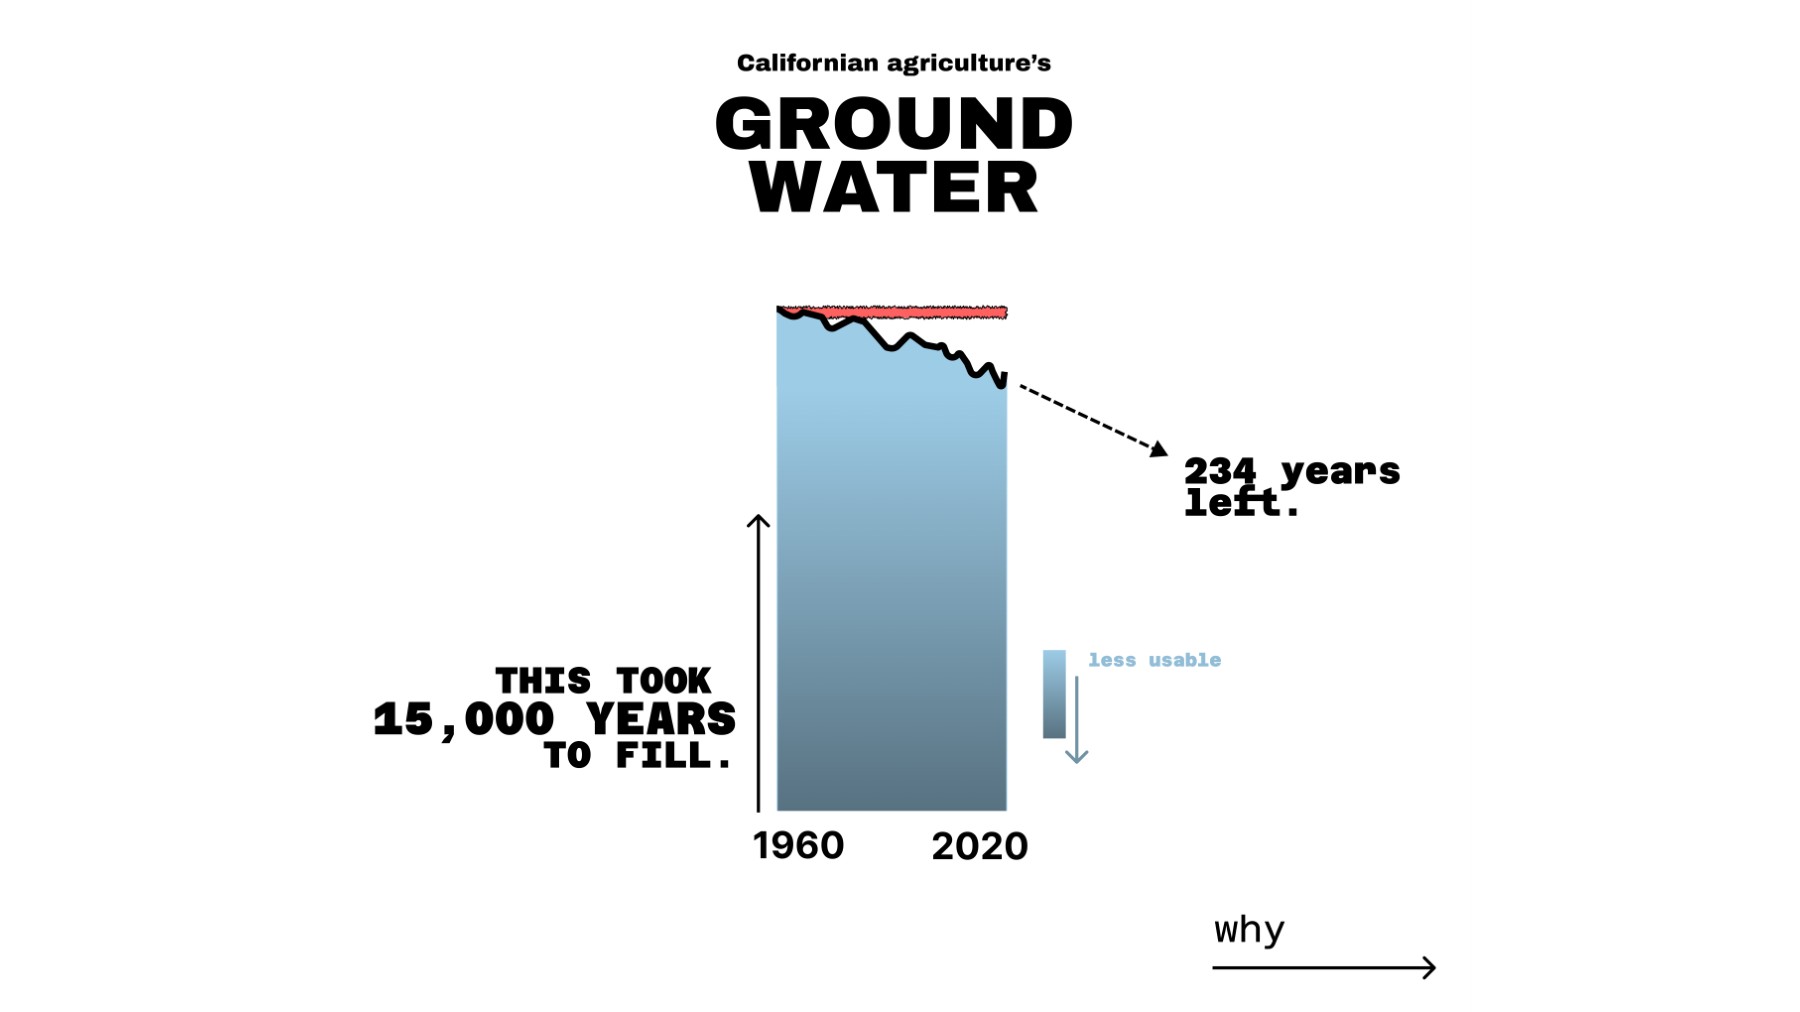
Original projection estimating 250 years of viable aquifer extraction remaining in the Central Valley, built on USGS and GRACE satellite data.
Python · QGIS · Illustrator
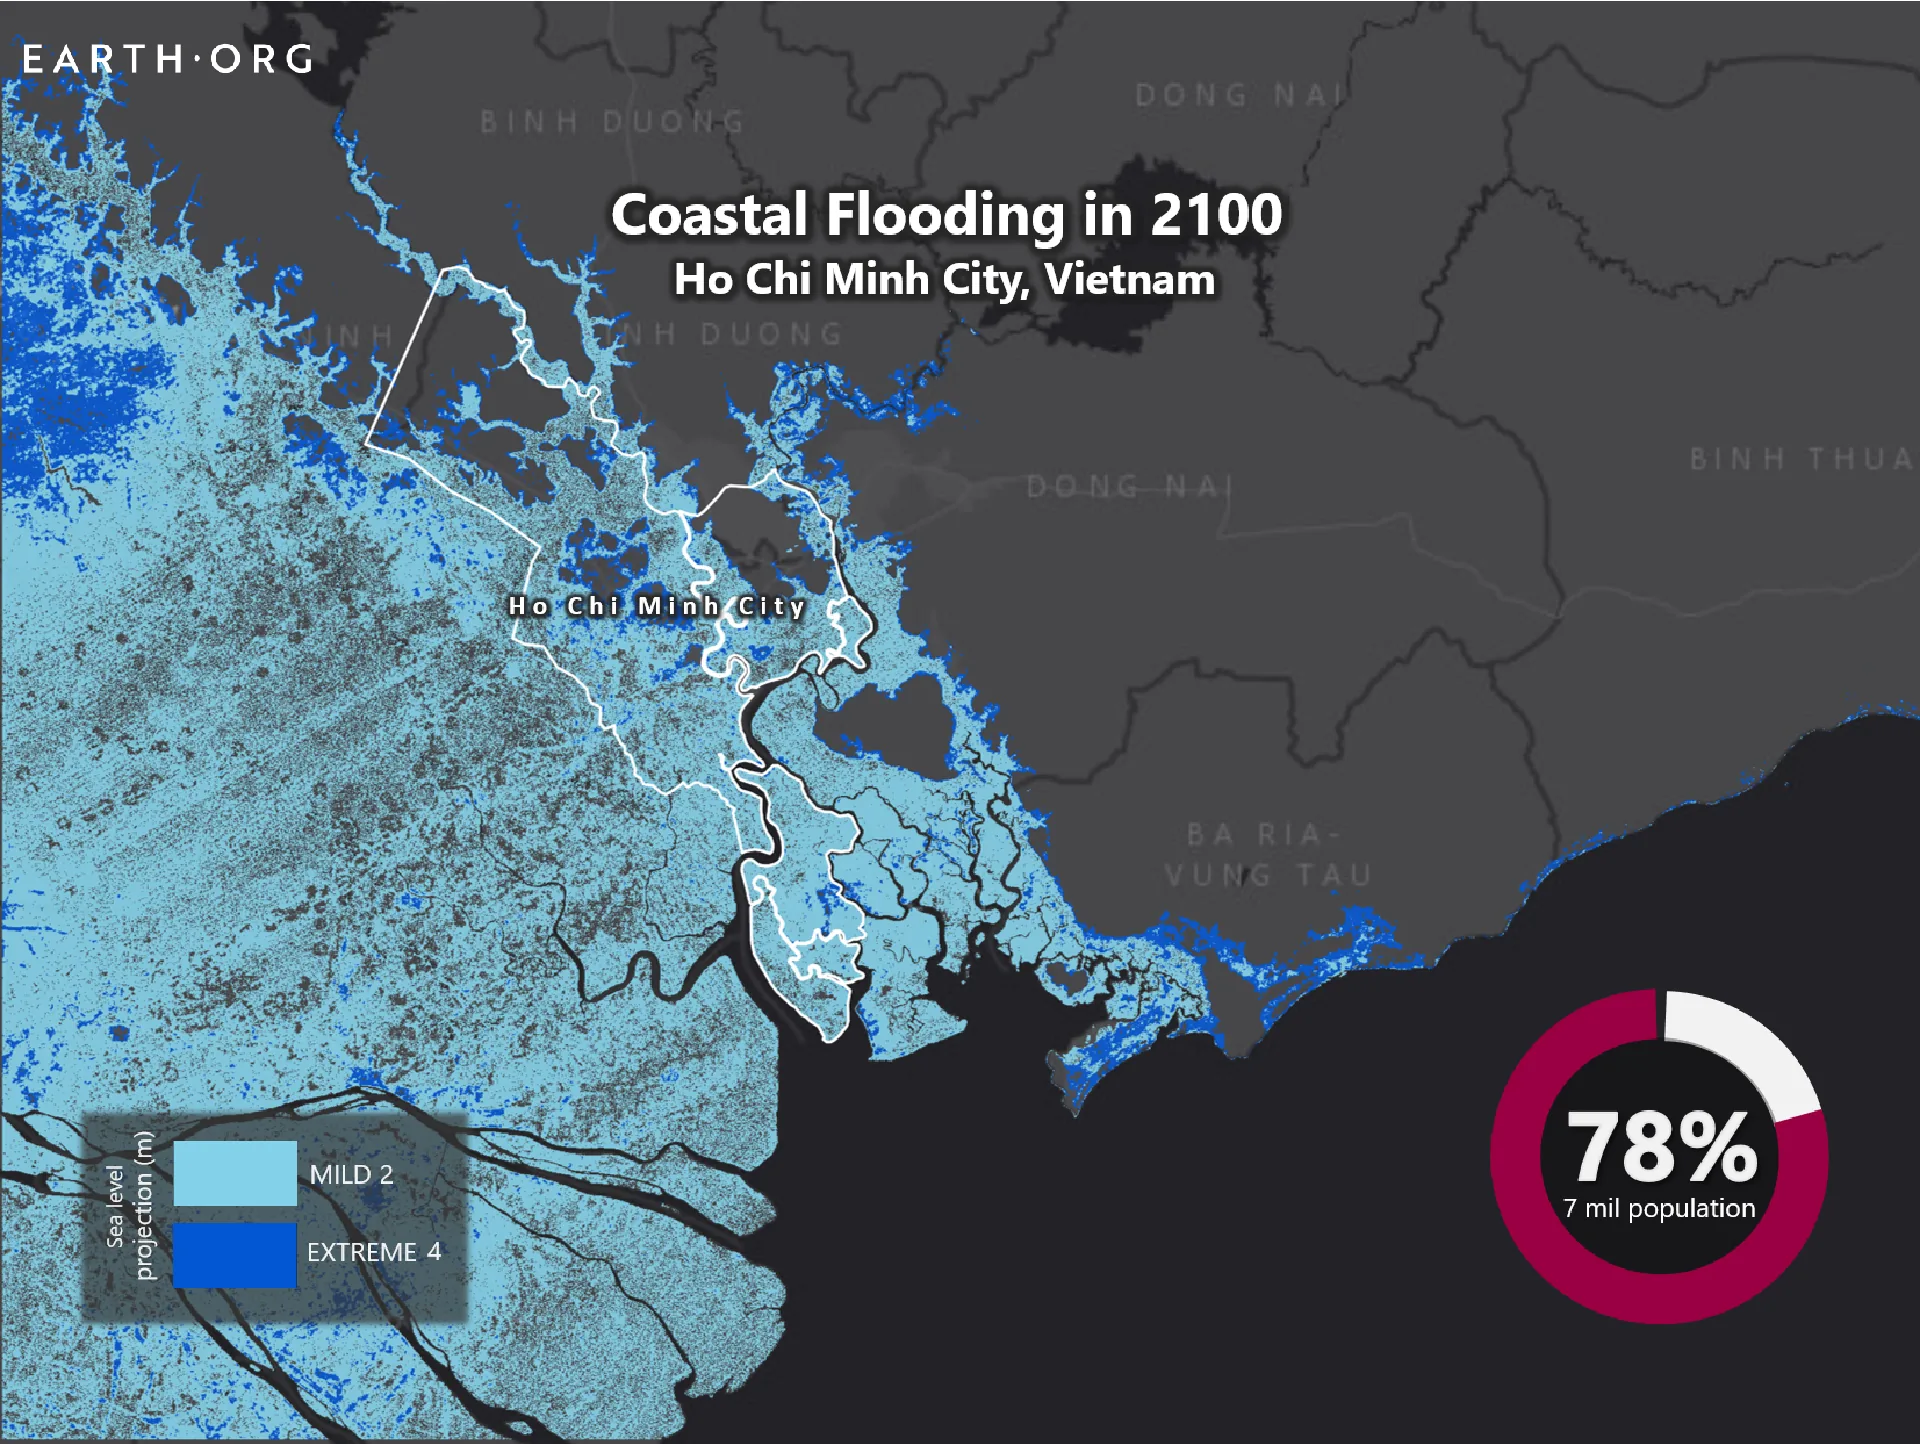
Dataviz series · 2021
Six major coastal cities under projected 2100 sea level rise scenarios. Cited in US law reviews and university research.
Python · QGIS · Illustrator
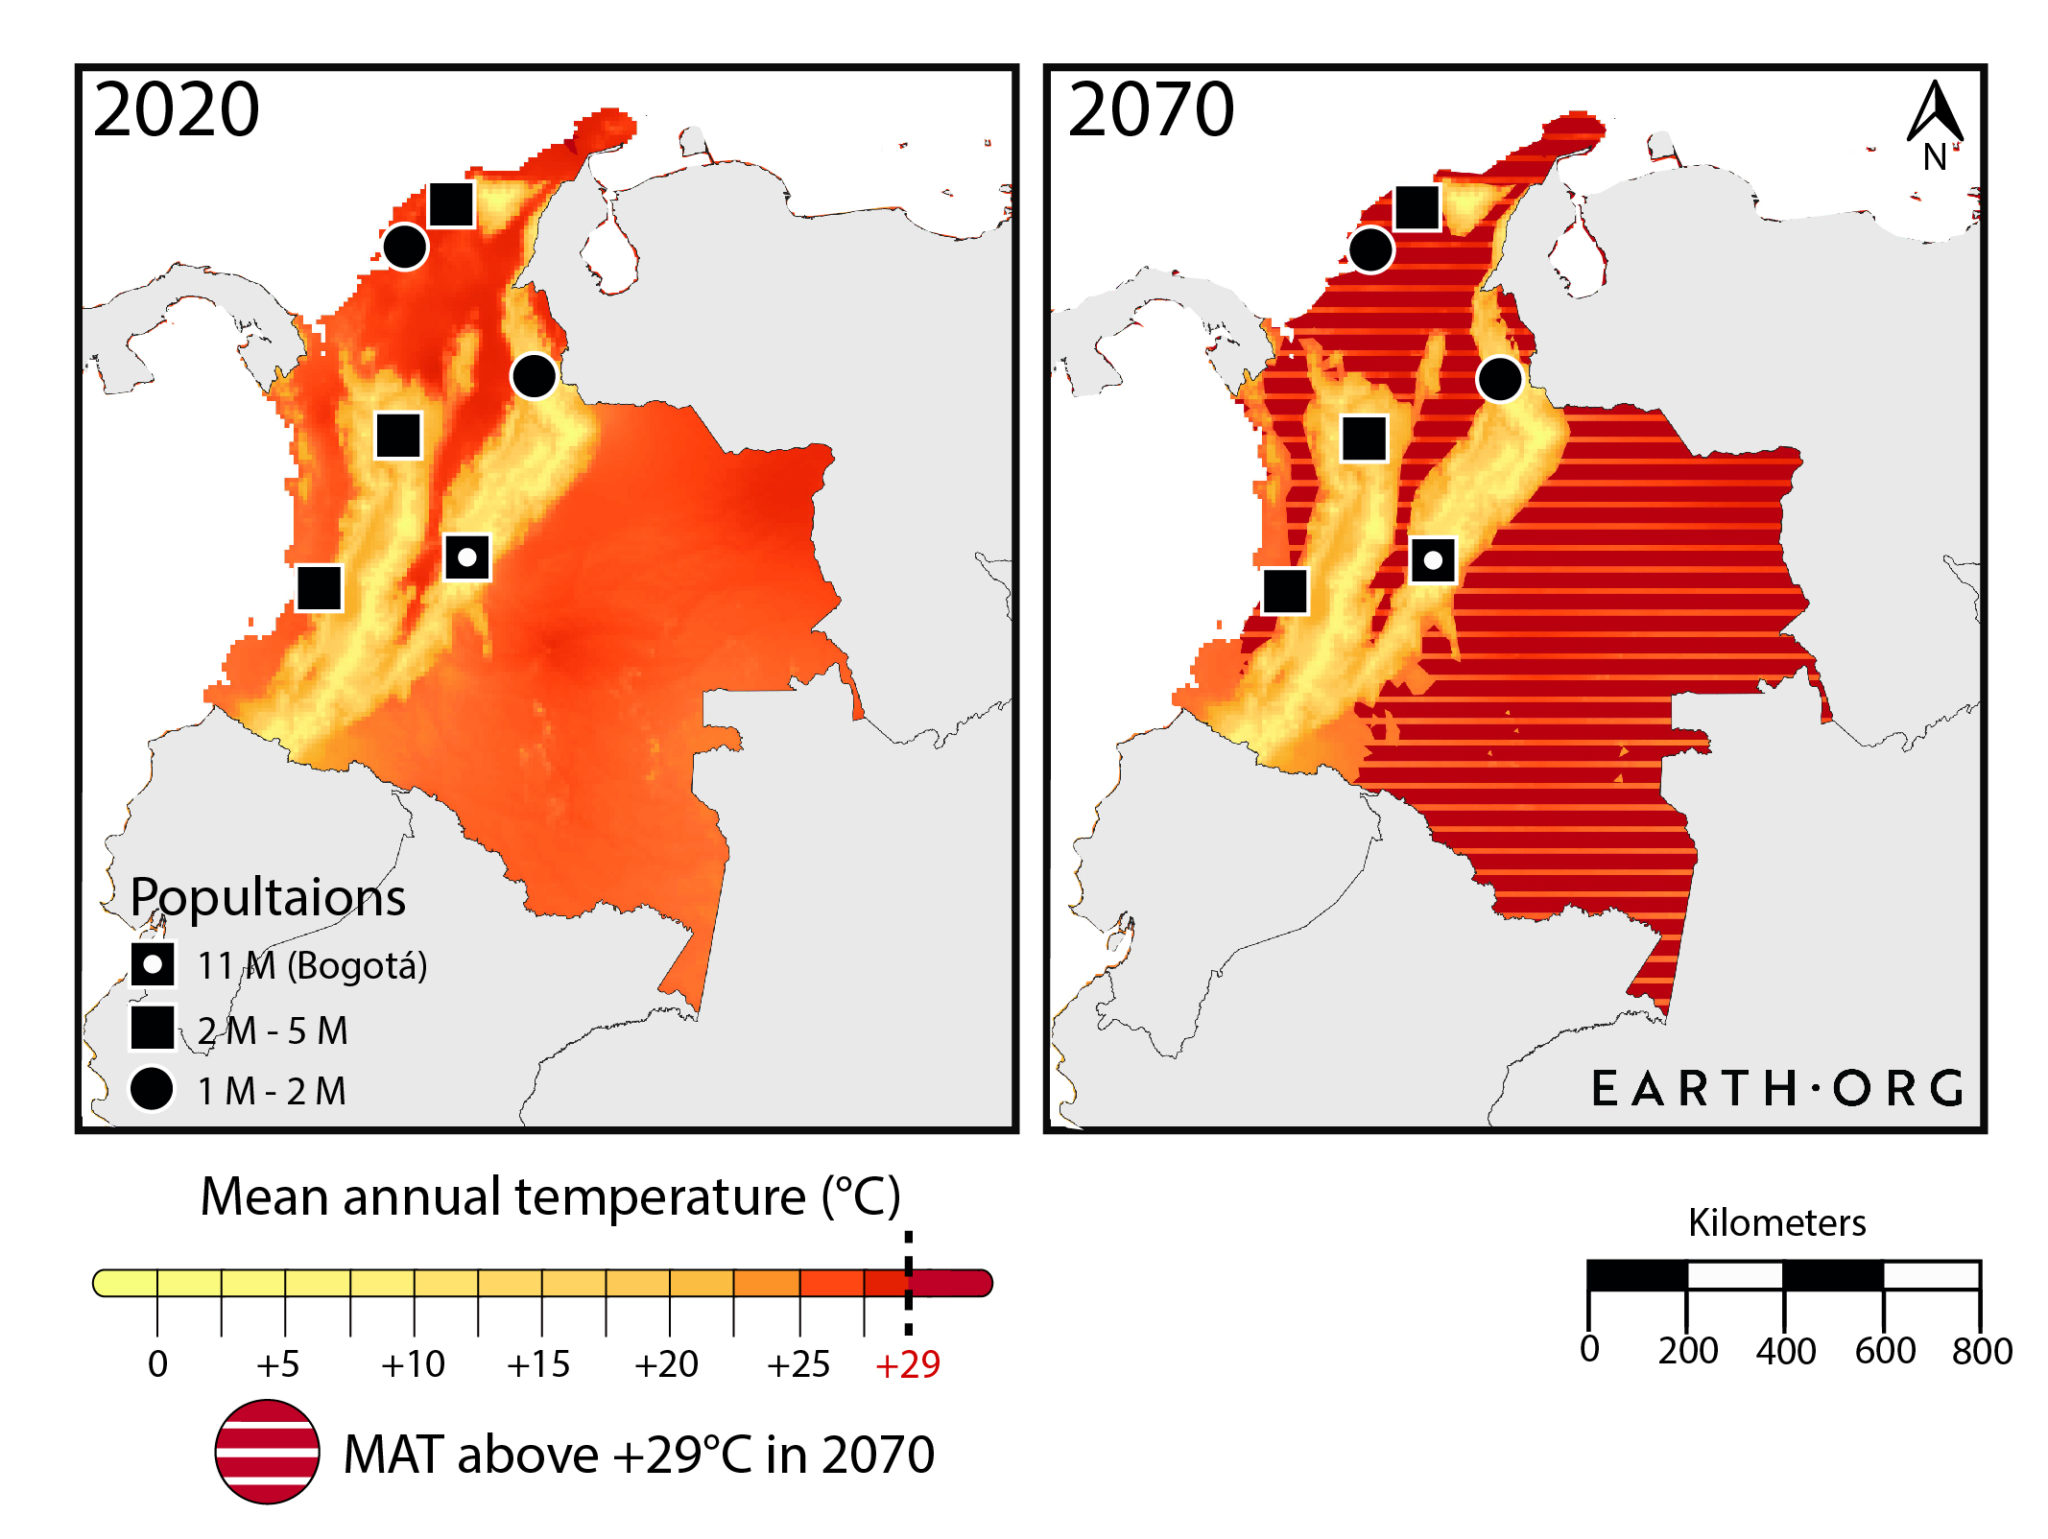
Long-form series · 2021
Wet-bulb temperature thresholds and the physical limits of human habitability across Latin America and the Middle East.
Python · R · Illustrator
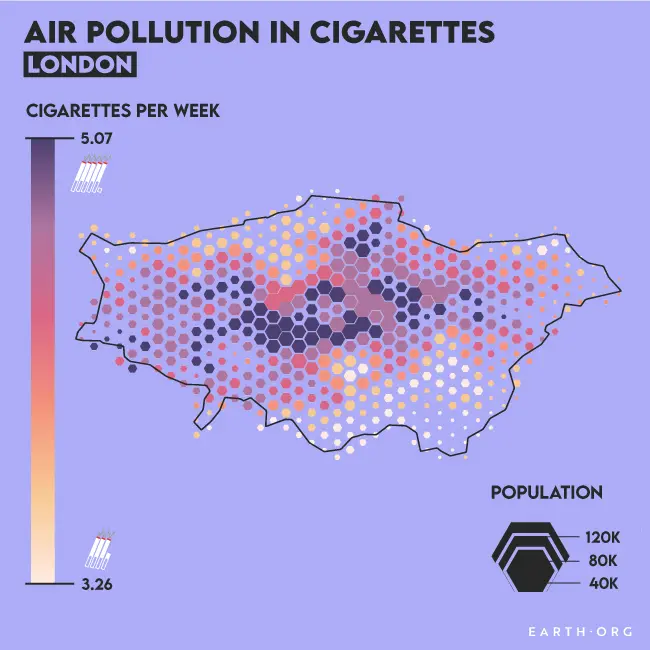
Dataviz · 2021
London's air pollution mapped as cigarette equivalents per week, visualising exposure by borough and population density.
Python · QGIS · Illustrator
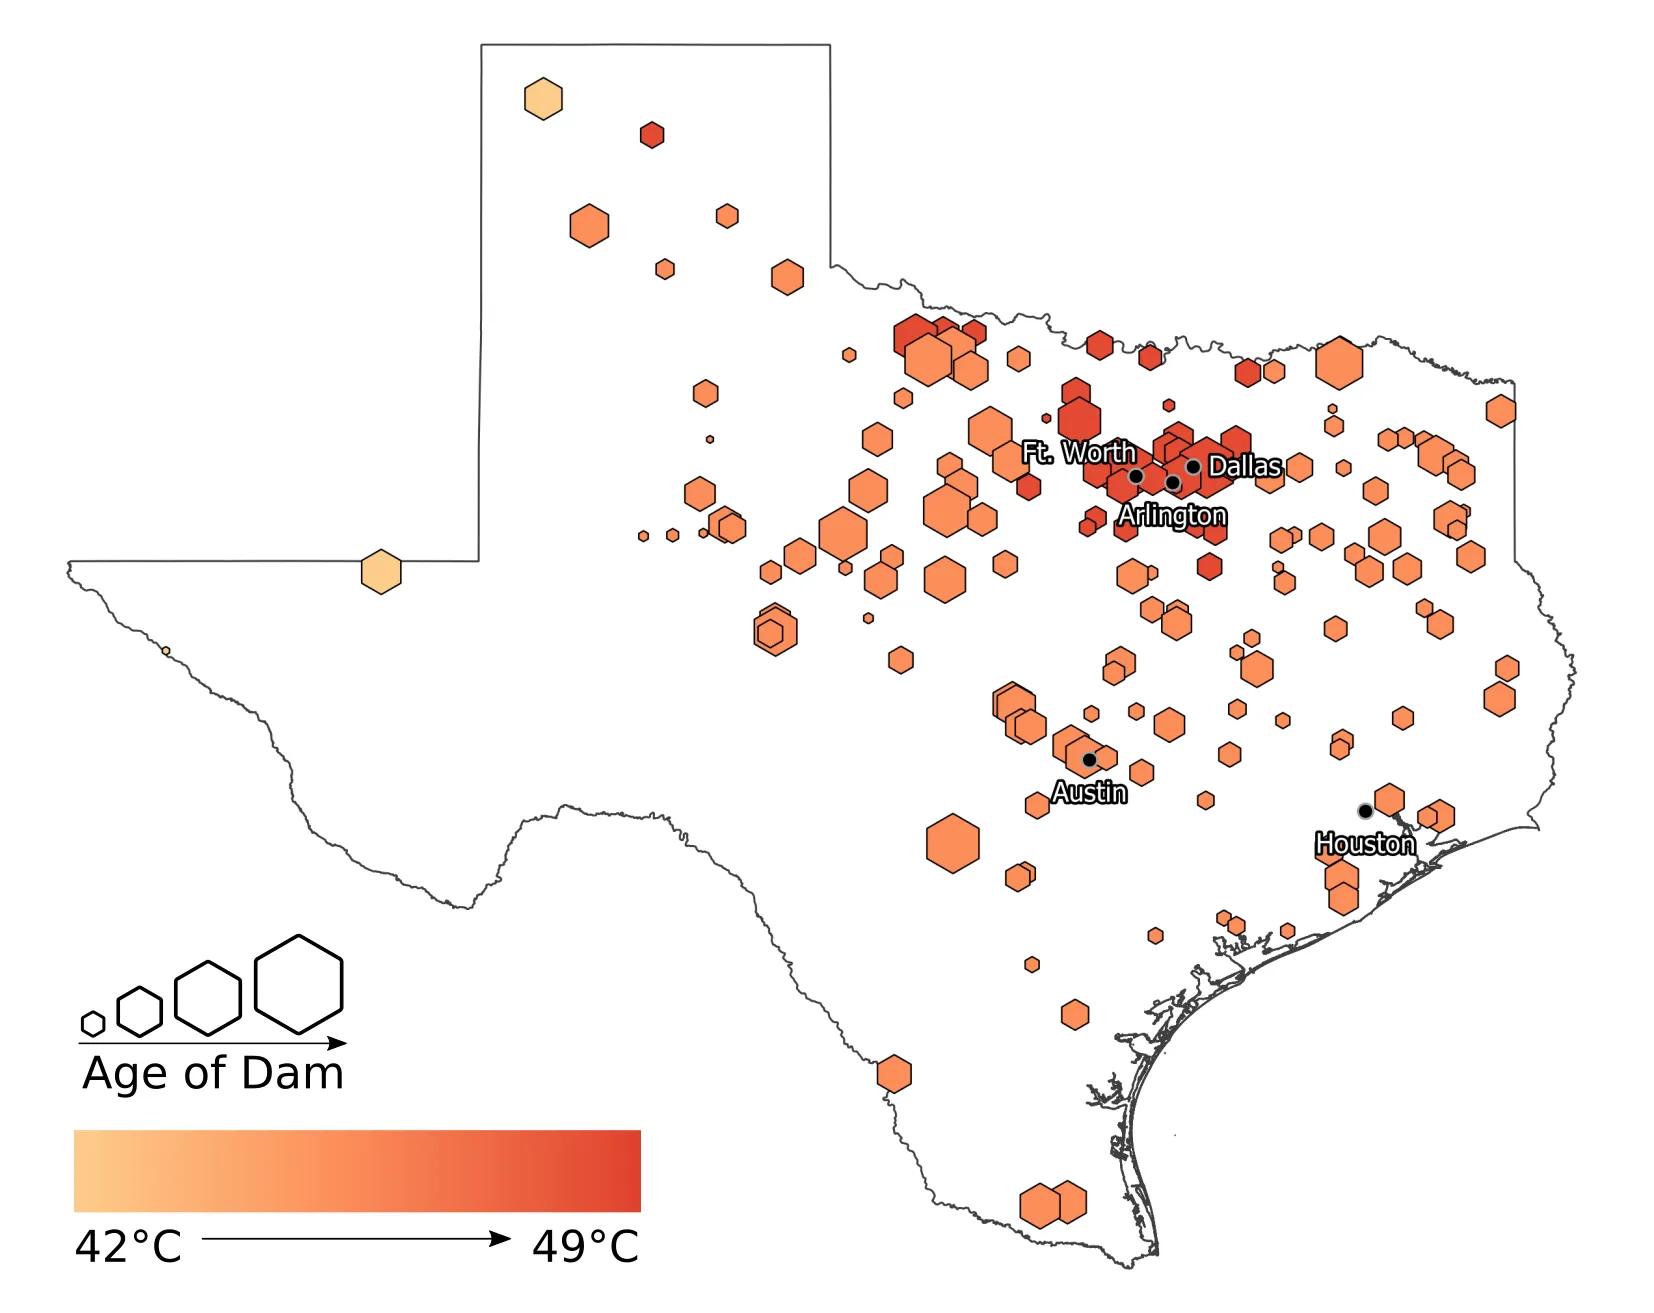
Dataviz · 2020
Mapping the 91,000 US dams by age and projected heat exposure under 2°C and 4°C warming scenarios, using MPI-GE climate simulations.
Python · QGIS · Illustrator
Data journalism · 2021
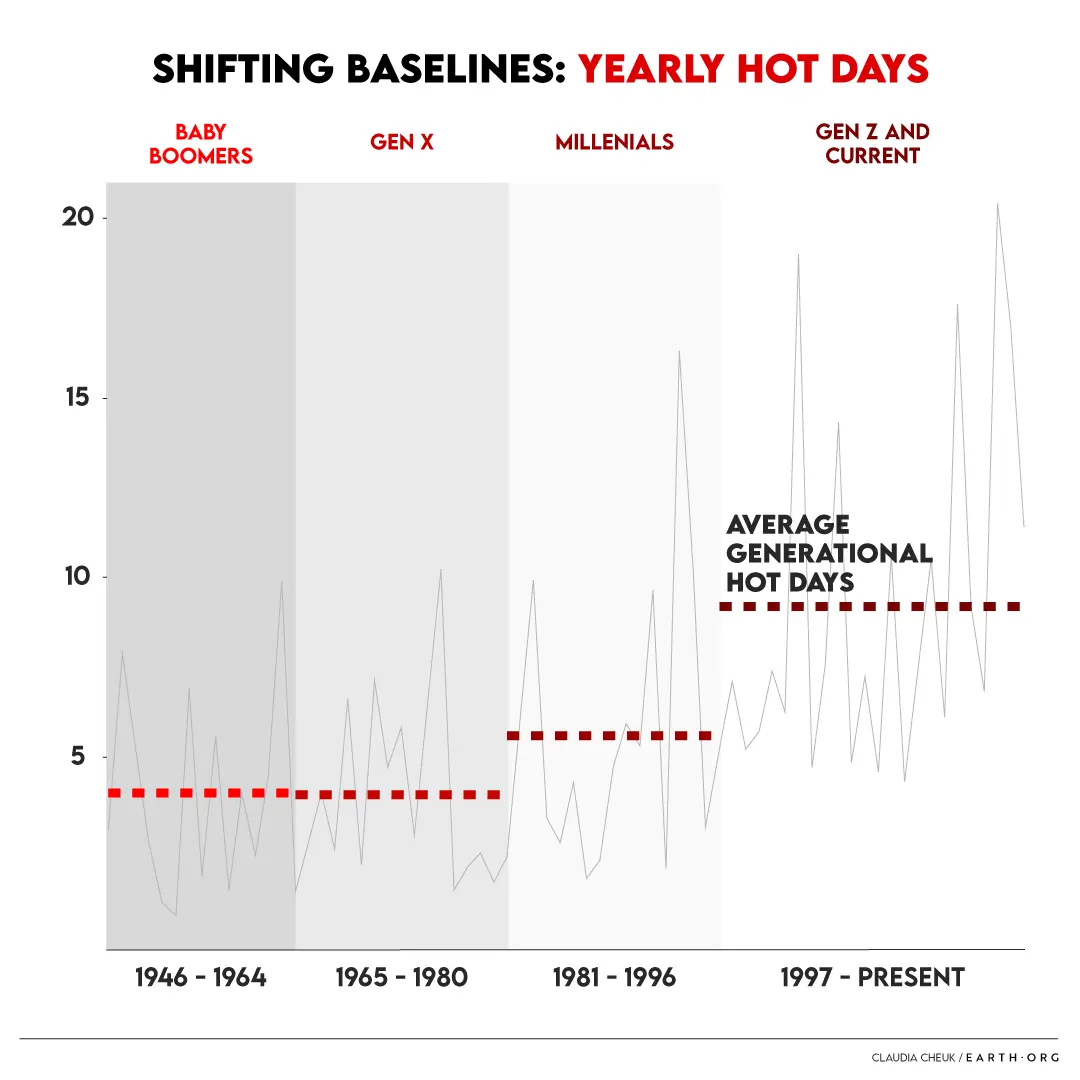
Why each generation accepts a warmer world as normal — charting the creeping rise in hot days from Baby Boomers to Gen Z.
Python · Illustrator
Dataviz series · 2020
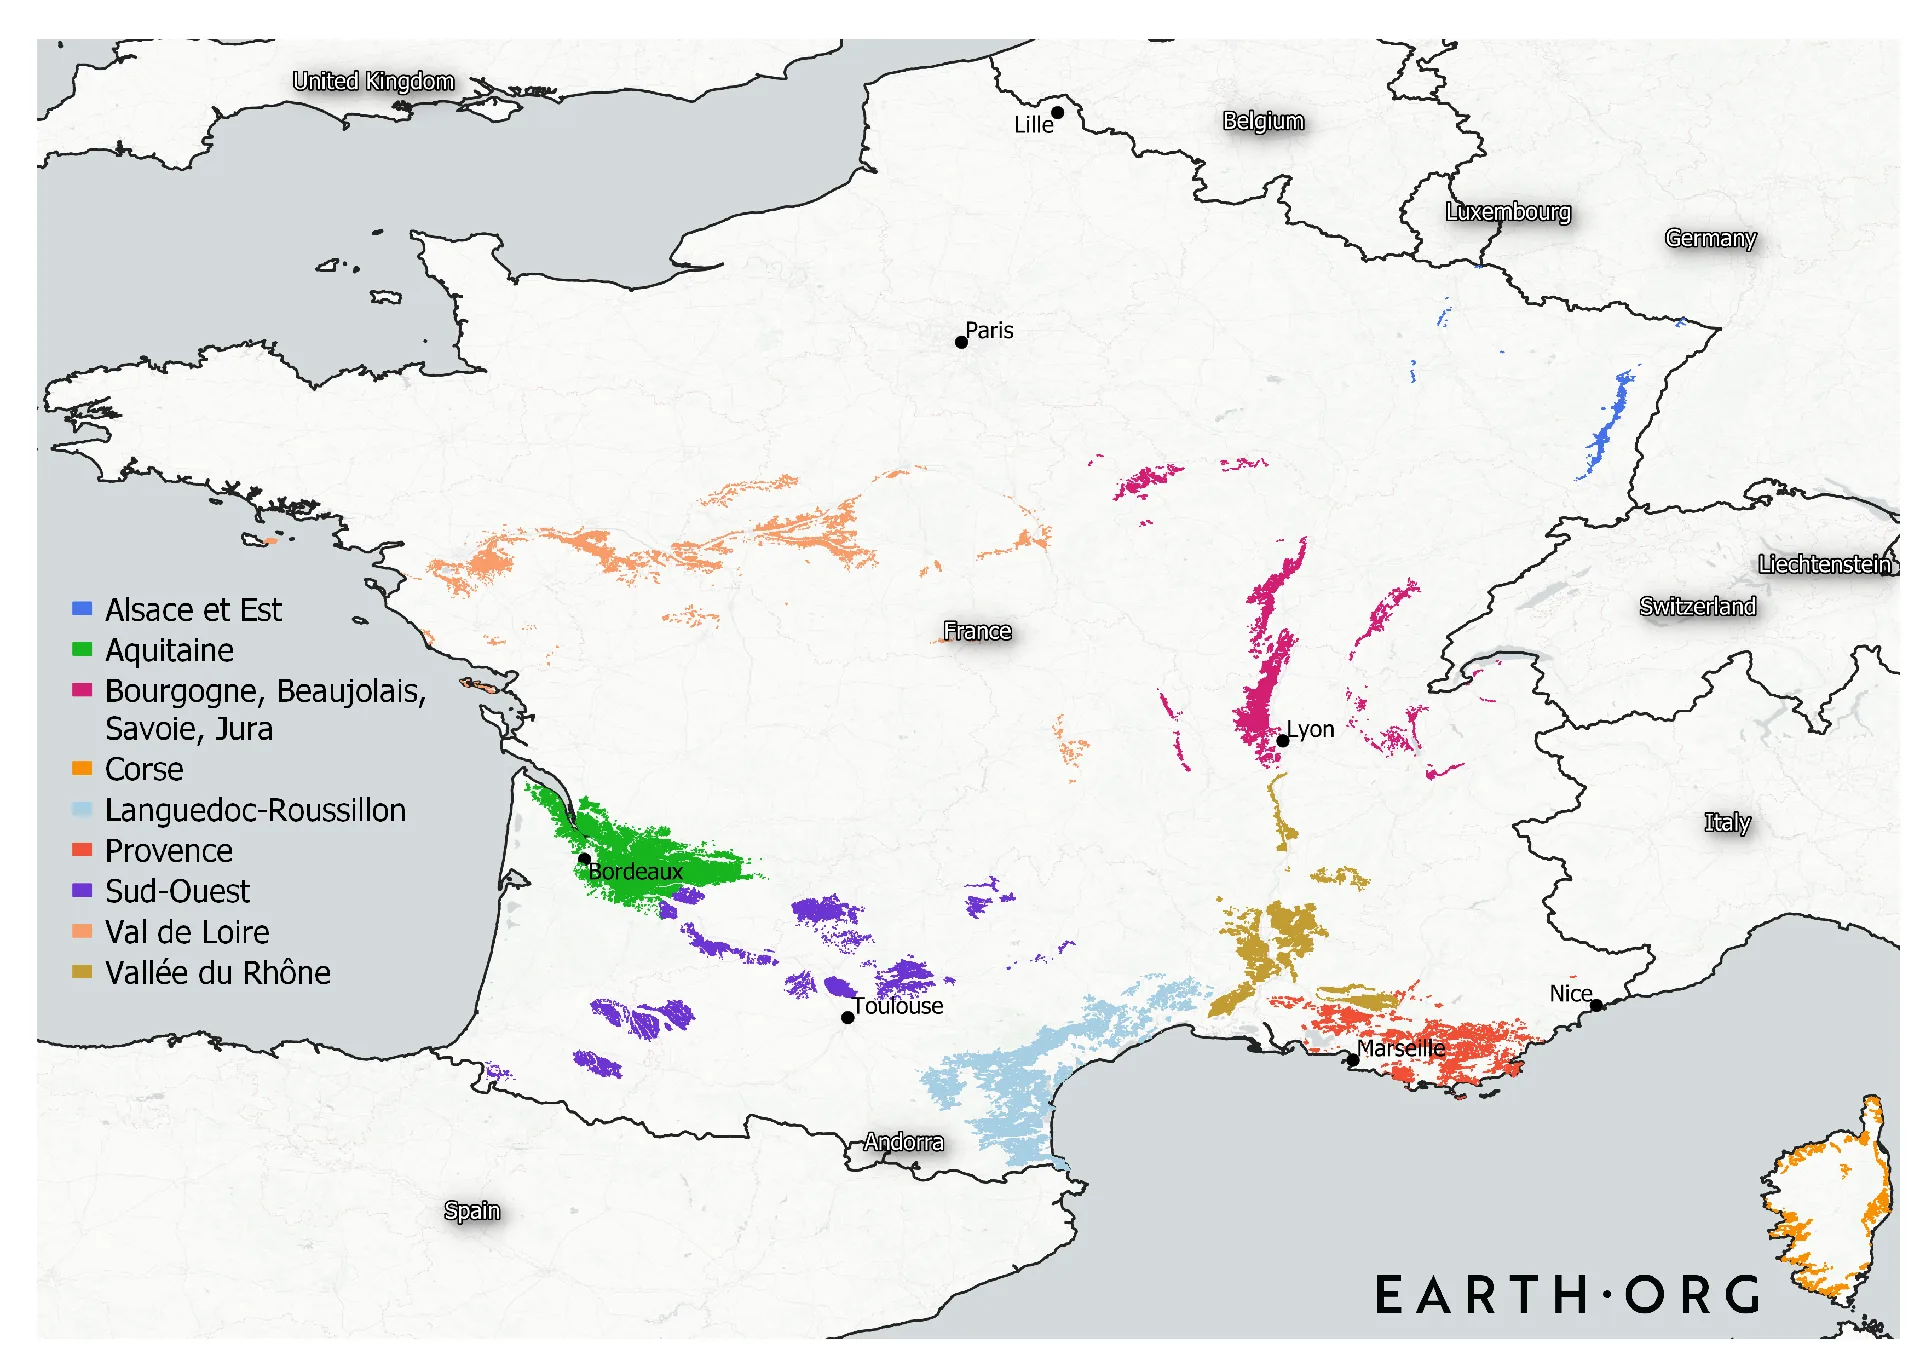
How projected heat extremes under 2–4°C warming threaten France's dairy and wine industries, mapped by agricultural region.
Python · QGIS · Illustrator
Dataviz series · 2020
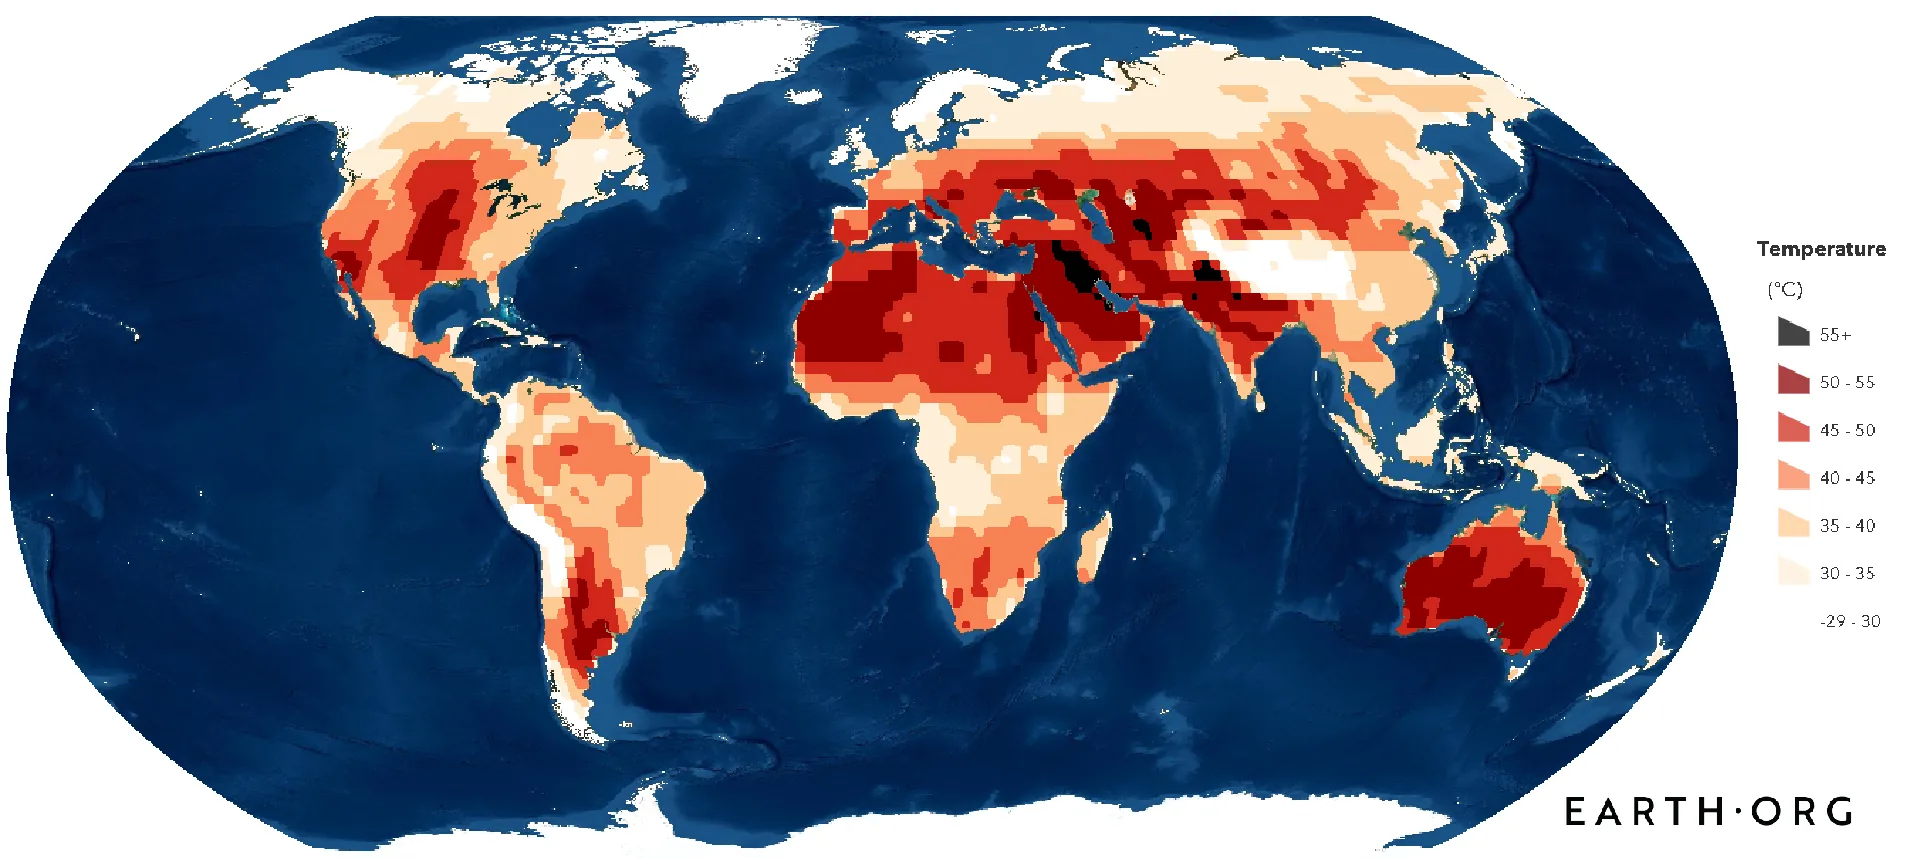
Global hotspot mapping of peak summer temperatures under warming scenarios, with focus on Canada's canola crop and food security.
Python · QGIS · Illustrator

Semrush · 2024–2025
Managed Semrush's acquired email assets, The Growth Bulletin and The Early Checkout. Overhauled the email programme, ran platform migrations, executed rebrands, and produced original content to drive brand PR, AI presence, and direct traffic. Content experiments doubled click volume. GA4 attribution audit resolved data discrepancies and restored purchase-path visibility.
The FACTS GEO Framework, Original AIO Framework
An original AI Optimisation framework built from Semrush proprietary research data — not a summary of existing guidance. FACTS gives content teams a measurable structure for performing in AI-generated search results, developed when most practitioners were still guessing. Source-first and methodology-transparent: the same rigour as the Earth.org research pieces, applied to a commercial SEO problem.
How to Build a Revenue-Generating Content Strategy
A tactical guide on mapping content directly to enterprise revenue pipelines. Covers funnel architecture, content-to-revenue attribution, and distribution for acquired media assets — written from the perspective of someone who has audited GA4 discrepancies, restructured attribution, and scaled email assets post-acquisition. Directly addresses how to track impact on LTV:CAC from first touch to close.
Marketing for Growth: Marketing & Finance
Long-form piece on the relationship between marketing investment and financial performance — the framing that PE portfolio teams and CMOs use to justify and structure budget allocation. Part of the ongoing Growth Bulletin editorial programme.
Thought Leadership Isn't for You
Edited for The Growth Bulletin. The brief: drive brand PR and AI presence for Semrush while producing opinionated, useful content for senior marketers.
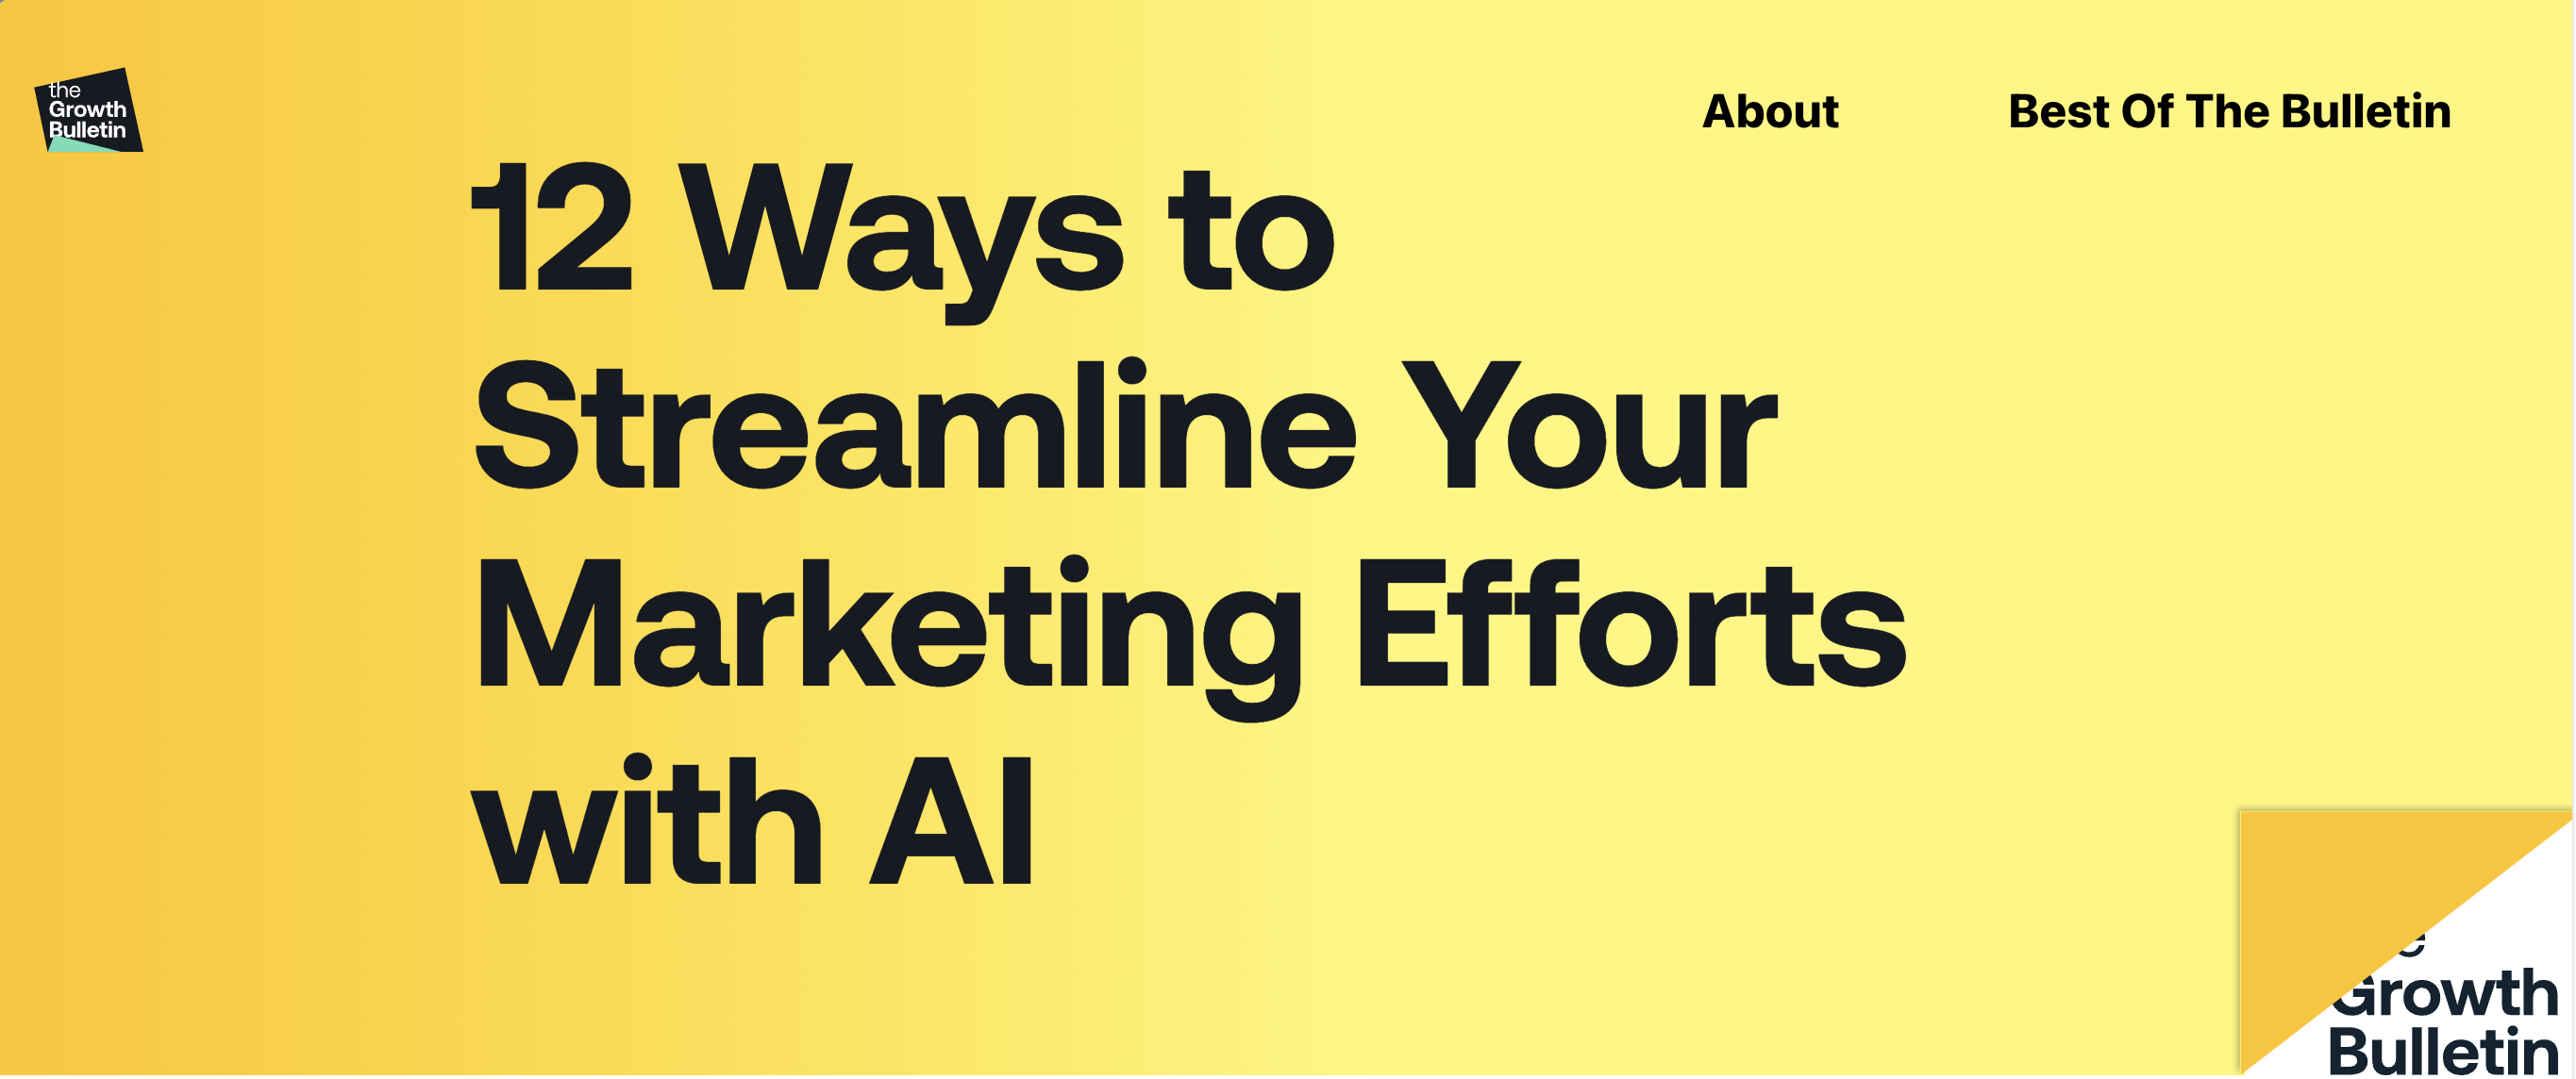
12 Ways to Streamline Your Marketing Efforts with AI
Edited for The Growth Bulletin. Part of the content experiment programme that doubled click volume over the engagement. Practical AI applications for marketing teams, structured to drive direct traffic to Semrush product pages.
Step-by-step SEO audit guide produced for Semrush's Growth Bulletin. A practical, tool-led walkthrough covering site speed, crawlability, and on-page fundamentals — designed as a high-value subscriber resource and lead magnet.
DTC Times · 2024
Contributed copy to the DTC Times newsletter, a publication covering direct-to-consumer marketing, ecommerce strategy, and brand building for practitioners.
Issue 22, AI, Speeches & Meta Legal Battles
Wrote Section 2: "The difference between growth and ad agencies", a practical breakdown of how the two agency types approach DTC client relationships differently.
Contributing copy on structural shifts in DTC market dynamics.
Sea Bass, Car Crashes & Static Ads
Contributing copy on ad creative strategy and the resurgence of static ad formats in performance marketing.
How the pandemic changed everything for outdoor DTC — the 7.1 million new participants in 2020 and the brands that became giants overnight.
Semrush · The Growth Bulletin & The Early Checkout
Newsletters produced for Semrush's two acquired email assets. Long-form issues are tactical, opinionated pieces aimed at senior marketers. Short-form issues are punchy, idea-led dispatches written for high open rates and click-through.
Long form
Let's make a bet…
God is dead
Short form
Breaking: Huge Insights on the AI Search Shift
Feeling… Direction-less?
The average business
Are you a sheep-person?
Semrush · 2024–2025
Sponsored placements written and designed for Semrush, distributed through third-party newsletters. The brief: short, punchy, personality-led copy and visuals that drive trials and free resource downloads.
Image & GIF ads
Copy
Newsletter ad · AI Text Summarizer
Is your special friend bringing up the same old argument while your mom is calling for the 15th time about your father who won't stop leaving twinkie wrappers between the couch pillows but you still have to read your boss' 1000-word email?
[Summarize it.]Like we should have with that sentence.
Newsletter ad · Google Ads
Let me tell you a story.
Googlads came home on a rainy night and had to apologize to his wife. The day's catch had been small, and it wasn't the first time. With a sad look at the empty pantry, he locked eyes with his wife who gave him an understanding nod. There was only one option left. The gods wanted blood.
It shouldn't take a sacrifice to get your Google Ads to work.
Learn how to optimize your campaign with real experts. For free.
Click here →Semrush · 2024–2025
Landing pages built for Semrush's email assets — copy, layout, and structure designed to convert newsletter visitors into subscribers and trial users.
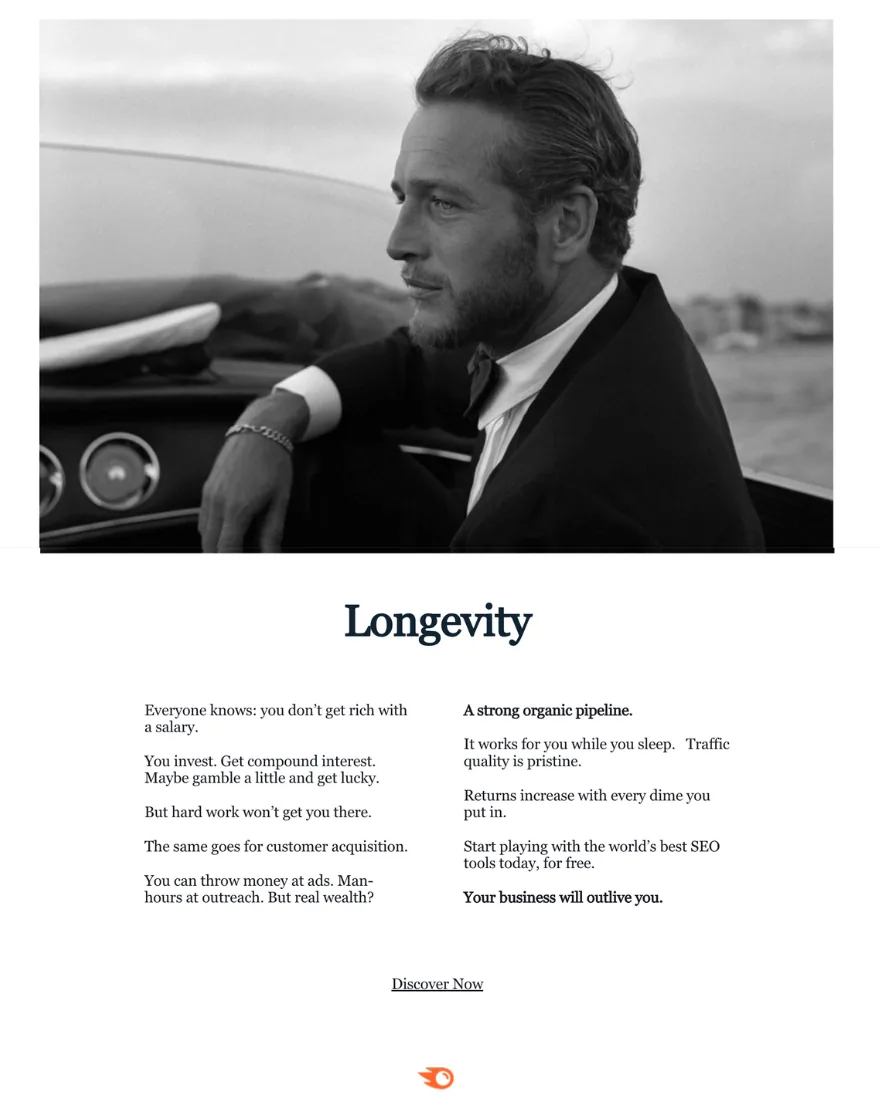
Newsletter landing page
Newsletter landing page for Semrush's acquired growth marketing asset. Copy, structure, and value prop built to convert growth marketers.
Earth.org · Original research
1 / 11
The headline figure, 250 years of viable extraction remaining, is an original calculation built on depletion rate projections from Scanlon et al. (2012) and CVHM2 hydrological basin modeling. Satellite GRACE data provides the empirical depletion curve.
Earth.org · Dataviz
Modelled six major coastal cities, Ho Chi Minh City, Miami, Vancouver, Brazil, Kuwait City, Persian Gulf, under projected 2100 sea level rise scenarios. Built from IPCC projections and city-level elevation data. Cited in US law reviews and university research on climate adaptation.
View on Earth.org ↗
Earth.org · Long-form data journalism
Long-form series examining wet-bulb temperature thresholds and the physical limits of human habitability. Covered Mexico, Colombia, and broader Latin American and Middle Eastern regions, combining climate modelling with on-the-ground reporting context.
View on Earth.org ↗
Earth.org · Dataviz
The US has around 91,000 dams with an average age of 57 years, 15,500 of which were classed as extremely hazardous in 2018. Using MPI-GE climate simulations, this piece maps Texan dams by age and projected peak temperature exposure under 2°C and 4°C global warming scenarios — visualising a largely invisible infrastructure risk.
View on Earth.org ↗
Earth.org · Data journalism
Each generation accepts the climate they are born into as normal, which is why the gradual heating of the planet goes largely unfelt. This piece charts yearly hot days in Germany across four generations — Baby Boomers through Gen Z — using German weather service data to make the shifting baseline visible.
View on Earth.org ↗
Earth.org · Dataviz series
Part of a series modelling the most extreme temperatures possible under 2–4°C warming using MPI-GE climate simulations. This piece focuses on France — mapping heat stress thresholds against dairy cattle tolerance and overlaying wine regions to show which appellations face existential risk.
View on Earth.org ↗
Earth.org · Dataviz series
Global peak summer temperature mapping under 4°C warming, with focus on Canada's canola crop — the world's second most produced vegetable oil and a crop whose yields collapse above specific heat thresholds. Part of the MPI-GE-based series on agriculture under extreme temperatures.
View on Earth.org ↗
Earth.org · Dataviz
London's air pollution expressed as cigarette equivalents per week — mapping PM2.5 exposure across boroughs with population density overlaid. The visualisation makes invisible harm legible: at its worst, breathing London's air is equivalent to smoking over five cigarettes a week.
View on Earth.org ↗