Earth.Org · Dataviz
Air Pollution in London
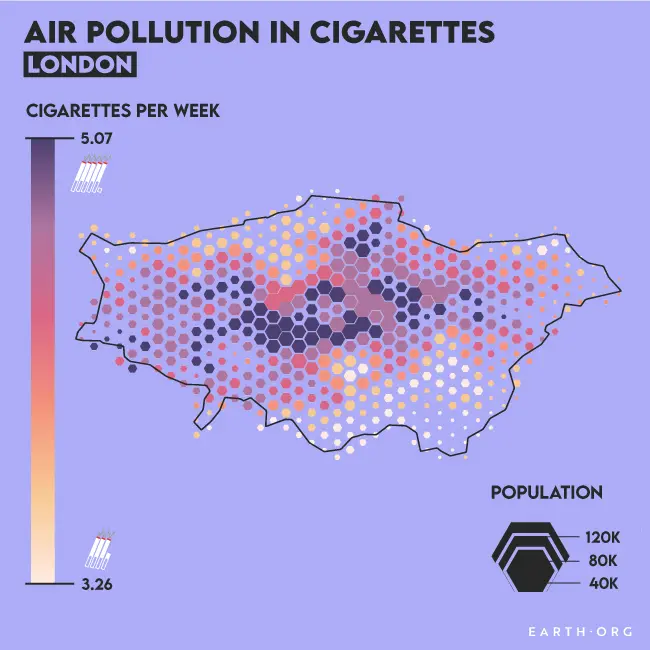
London's air pollution (PM2.5) translated into cigarettes smoked per week and mapped across the city. In 2016, the whole of London was breathing the equivalent of 3 to 5 cigarettes a week, above the WHO guideline everywhere.
- Published
- Earth.Org, 28 April 2021
- My role
- Data Journalism Team Lead (2020 to 2022)
- Tools
- Python, QGIS and Adobe Illustrator
What it shows
London's air pollution (PM2.5) translated into cigarettes smoked per week and mapped across the city. In 2016, the whole of London was breathing the equivalent of 3 to 5 cigarettes a week, above the WHO guideline everywhere.
What I did
Data Journalism Team Lead at Earth.Org (January 2020 to January 2022), leading a volunteer data team of between 5 and 15 people. For each piece I conceptualised it, did the research and directed the number crunching and the final design. A graphic designer handled final production.
Data and methods
PM2.5 concentrations for 2016 from NASA-SEDAC, converted to cigarette equivalents with Berkeley Earth's PM2.5-to-cigarettes conversion.
Full sources are listed in the original article.
Tools
Python, QGIS and Adobe Illustrator.
Who I worked with
Earth.Org's data team was made up of volunteer contributors from around the world, between 5 and 15 people at a time.
Limits
The map shows 2016 data, the most recent available when the piece was written, so it is a snapshot and not a current reading. The cigarette equivalent is a communication device based on a published conversion, not a measure of health outcomes.