Independent work · 2026
California Groundwater Crisis
A 12-slide series asking how long California's Central Valley groundwater would last at the recent rate of loss. The answer is about 202 years, roughly half the 390 years in the widely cited 2012 study, and the page shows how the number was built.
- Year
- Independent work, 2026
- Role
- Research, analysis and design, done hands-on by me
- Tools
- Python, Google Sheets, Figma
- Data
- USGS CVHM, NASA GRACE (via DWR), DWR dry-well records
1 / 12
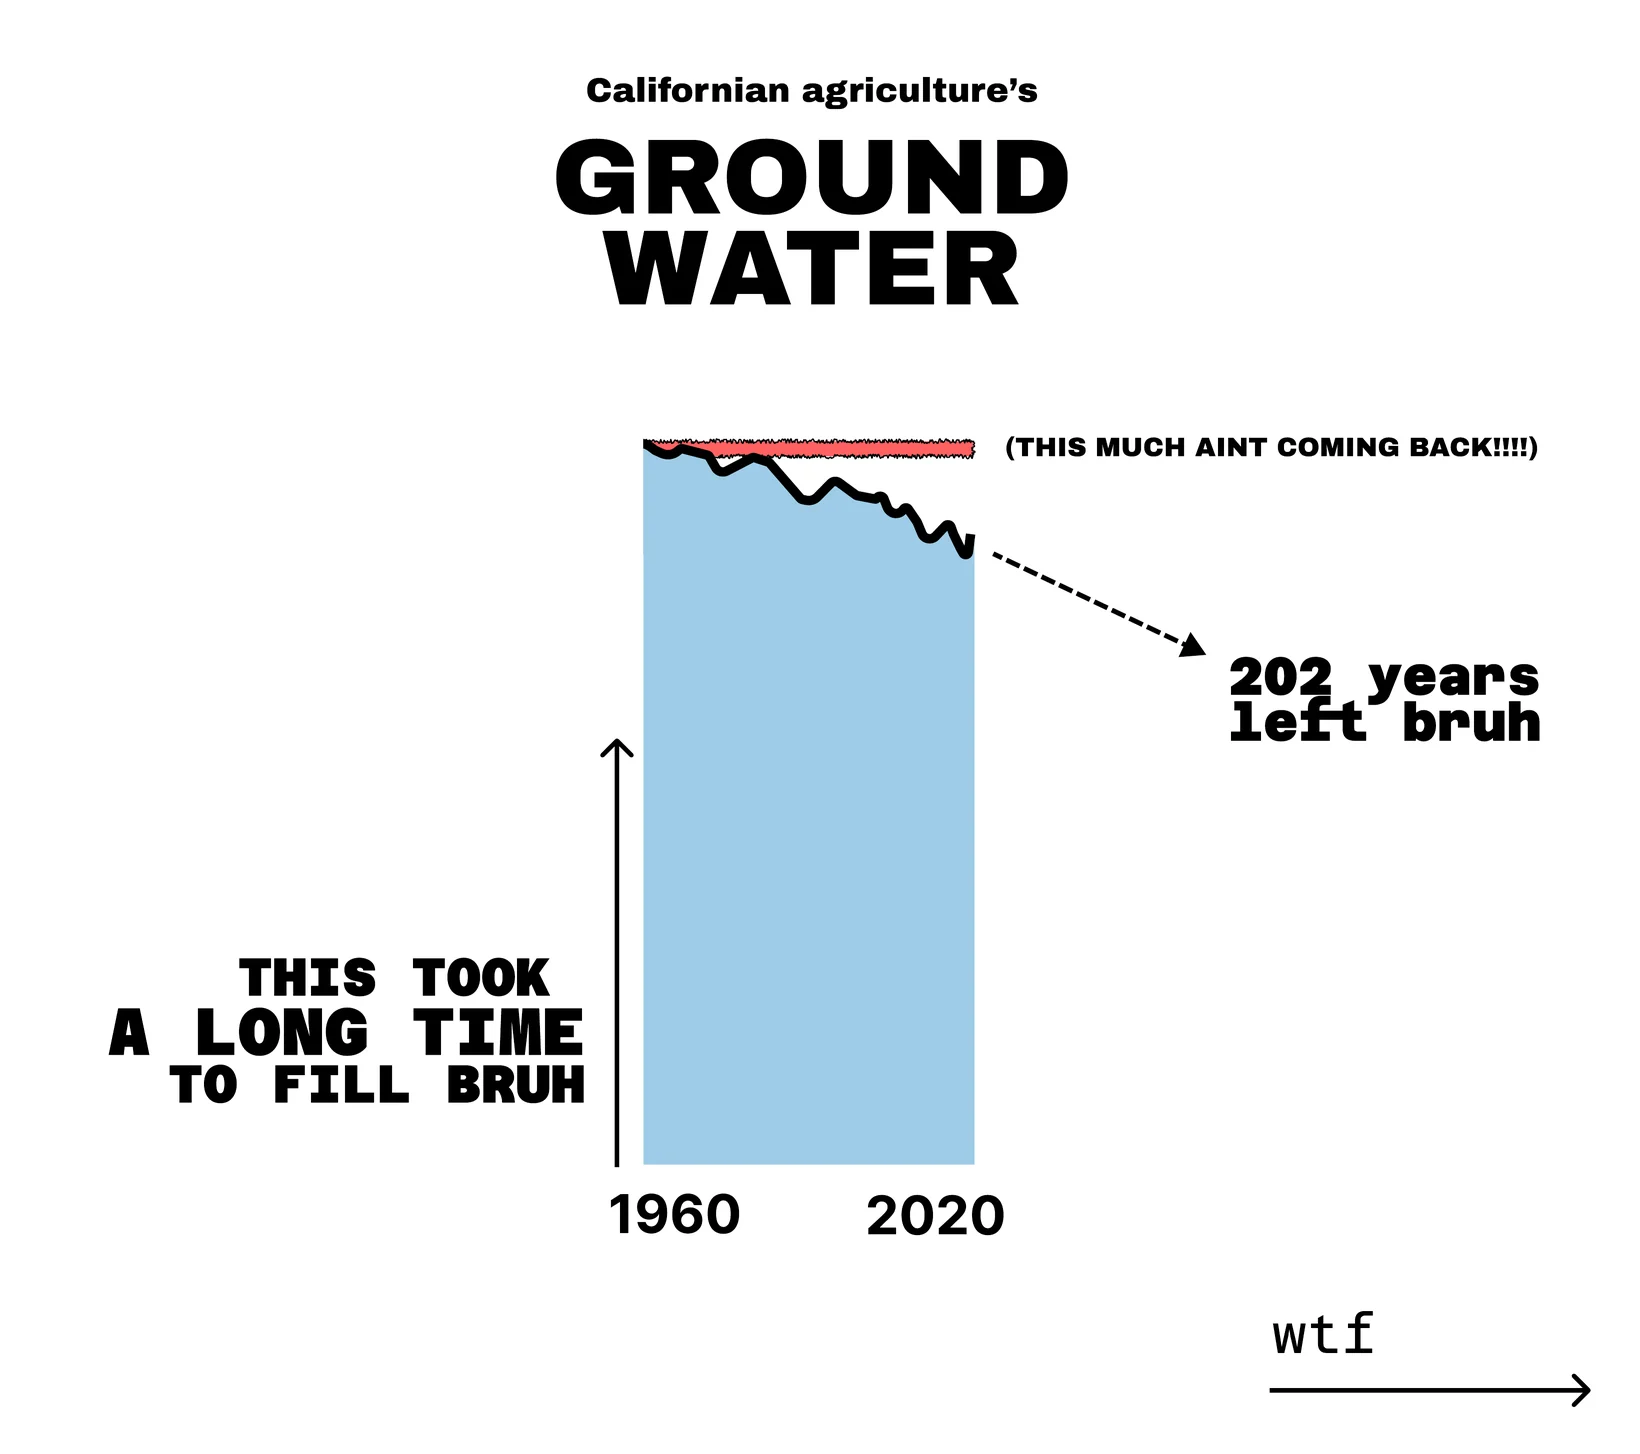
Californian agriculture's groundwater
The blue block is the Central Valley's stored groundwater; the red band is the part that is not coming back. An estimated 788 km³ remained in 2023, and satellite data show storage falling by about 3.9 km³ a year (the 2006 to 2023 trend). At that rate it lasts about 202 years from 2023, to around 2225. That is a straight-line projection of total storage, not of usable water (see the next slide), and other trend windows give roughly 200 to 245 years (see the methods). The deep layers took a very long time to fill and shallower layers cycle much faster, so there is no single fill time.
The problem
Central Valley farms lean heavily on groundwater, and the water table has been falling for decades. The question I wanted answered was simple: if it keeps falling at the recent rate, how long does the stored water last?
A widely cited 2012 study (Scanlon et al., PNAS) put the answer at about 390 years. That number is now old, and the loss has not slowed. I wanted to update it with the years since, and show how the number is built so that anyone can check it.
The series goes on to show who uses the water (agriculture is roughly nine-tenths of Central Valley groundwater use, slide 5) and what happens to households when wells run dry (slides 8 to 10).
What I did
- Built the curve of stored water. From the early 1960s to 2014 I used modelled storage change from the USGS Central Valley Hydrologic Model. From 2006 to 2023 I used NASA satellite measurements (GRACE and GRACE-FO) as processed by California's Department of Water Resources. The two come from different methods, so where they join is approximate.
- Started from the 2012 study's numbers. It counted 860 km³ of storage remaining in 2000, drawn down at 2.2 km³ a year. That is where 390 years comes from (860 ÷ 2.2).
- Brought the storage up to date. I estimate about 71.6 km³ was lost between 2000 and 2023, which leaves about 788 km³.
- Measured the recent rate. A straight line through the satellite series from late 2006 to the end of 2023 falls by about 3.9 km³ a year, roughly 1.8 times the rate in the 2012 study.
- Divided. 788 ÷ 3.9 is about 202 years, counted from 2023.
- Followed the people. The dry-well slides use the State's dry-well reporting records, with household costs sourced to the State Water Board, DWR and others. Every number on those slides is traced on the methods page.
Tools, and how they fit together
Python for the analysis and the charts, Google Sheets for converting the satellite data's units, and Figma to turn the charts into the slides. The numbers flow one way: public datasets, then the analysis, then the slides, with every caption written to say where its number came from.
Result
About 202 years of storage left at the recent rate, counted from 2023, roughly half the 2012 study's 390. Measuring the recent rate over different windows gives anything from about 200 to 245 years, so the honest summary is "a bit over two centuries, not a precise year".
This is independent work. It was not commissioned.
Limits
This extends a published model. I did not independently re-verify the original volume estimates. The satellite data and the hydrological model do not reconcile cleanly, and the estimate assumes the recent rate continues, which it may not: droughts have sped up the loss, and the Sustainable Groundwater Management Act could slow it.
The figure counts stored water, not usable water. As the water table falls, what is left is deeper, costlier to pump and can be of poorer quality, so the practical limit would arrive sooner. Land subsidence has also permanently reduced storage capacity (about 15% of what has been drawn, per USGS), which the calculation does not model.
Technical detail
Datasets and citations
- Storage curve to 2014: USGS Central Valley Hydrologic Model, from the dataset published with Liu et al. (2022), Groundwater depletion in California's Central Valley accelerates during megadrought, Nature Communications (dataset doi 10.5281/zenodo.7392554).
- Storage curve 2006 to 2023: DWR's GRACE groundwater storage anomaly series for the Central Valley (194 monthly values, with a gap from May 2017 to May 2018 between the two satellite missions).
- Baseline: Scanlon et al. (2012), PNAS 109:9320-9325.
- Dry wells: DWR Household Water Supply Shortage Reporting System, published on the California Natural Resources Agency open data portal.
The calculation, and how sensitive it is
788 ÷ 3.9 ≈ 202 years. The rate is the slope of an ordinary least-squares line through the monthly satellite series (3.905 km³ a year, R² = 0.74). The window used for the trend is a choice, and it moves the answer:
| Trend from | km³ a year | R² | Years left |
|---|---|---|---|
| Oct 2006 (used) | 3.9 | 0.74 | 202 |
| 2008 | 3.6 | 0.68 | 218 |
| 2010 | 3.55 | 0.59 | 222 |
| 2012 | 3.25 | 0.46 | 243 |
| 2014 or 2015 | 1.9 | 0.14 to 0.18 | about 400 (poor fit, not relied on) |
The full working, with every source, is on the methods and sources page.