Earth.Org · Dataviz
Hotspots: US Dams Under Pressure
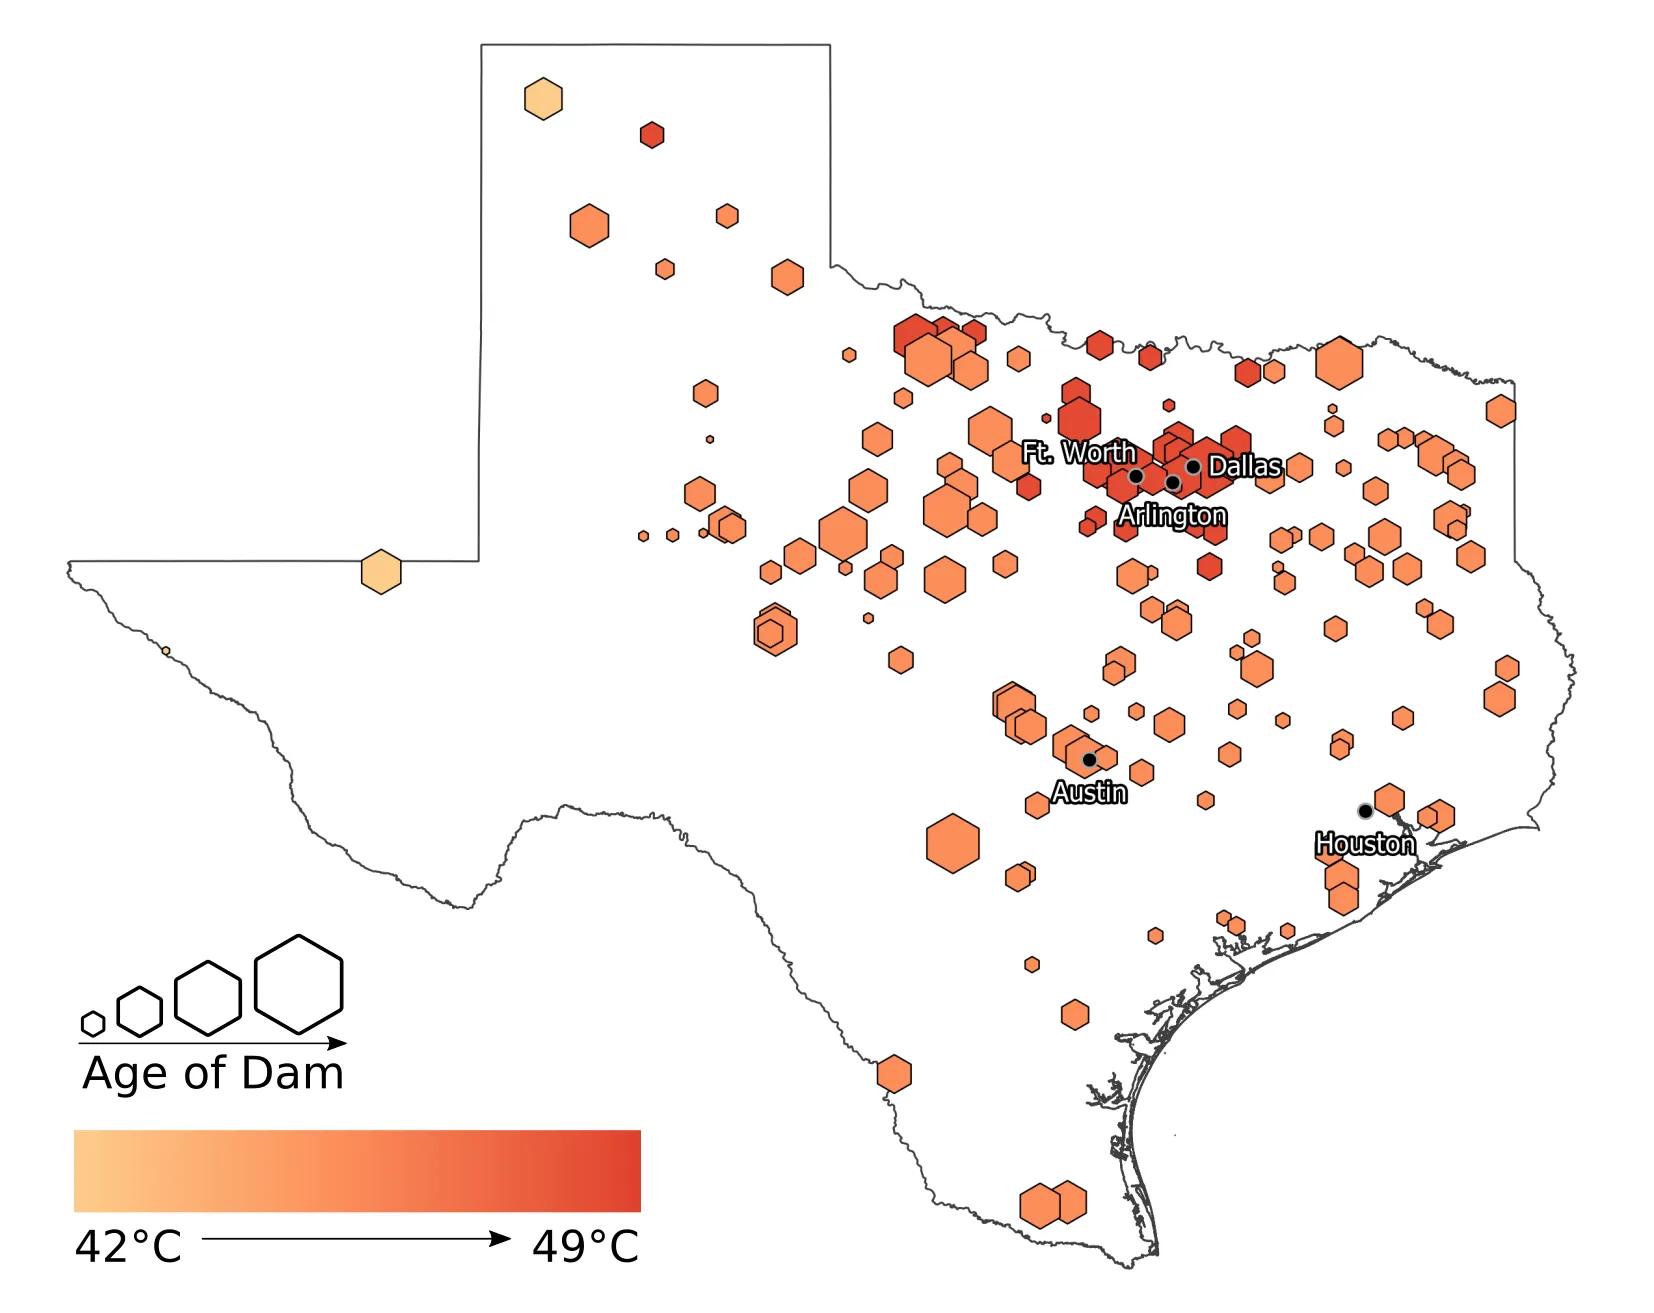
The US has around 91,000 dams, many of them old. This piece maps Texas dams by age against the most extreme summer temperatures projected under 2°C and 4°C of global warming, to show where ageing infrastructure and extreme heat overlap.
- Published
- Earth.Org, 23 November 2020
- My role
- Data Journalism Team Lead (2020 to 2022)
- Tools
- Python, QGIS and Adobe Illustrator
What it shows
The US has around 91,000 dams, many of them old. This piece maps Texas dams by age against the most extreme summer temperatures projected under 2°C and 4°C of global warming, to show where ageing infrastructure and extreme heat overlap.
What I did
Data Journalism Team Lead at Earth.Org (January 2020 to January 2022), leading a volunteer data team of between 5 and 15 people. For each piece I conceptualised it, did the research and directed the number crunching and the final design. A graphic designer handled final production. Maps by Keir Murdo.
Data and methods
Extreme temperature simulations from the Max Planck Institute Grand Ensemble (MPI-GE), as used by Suarez-Gutierrez et al. (2020). The piece uses the 0.5% most extreme summer temperatures in each grid cell, set against the age of Texas dams.
Full sources are listed in the original article.
Tools
Python, QGIS and Adobe Illustrator.
Who I worked with
Earth.Org's data team was made up of volunteer contributors from around the world, between 5 and 15 people at a time. Maps by Keir Murdo.
Limits
The simulated extremes are rare, low-probability events, and they could occur anywhere in a mapped zone but not necessarily everywhere at once. The piece is a brief illustration for Texas, not an engineering assessment of any individual dam.