Earth.Org · 2020
Sea Level Rise 2100
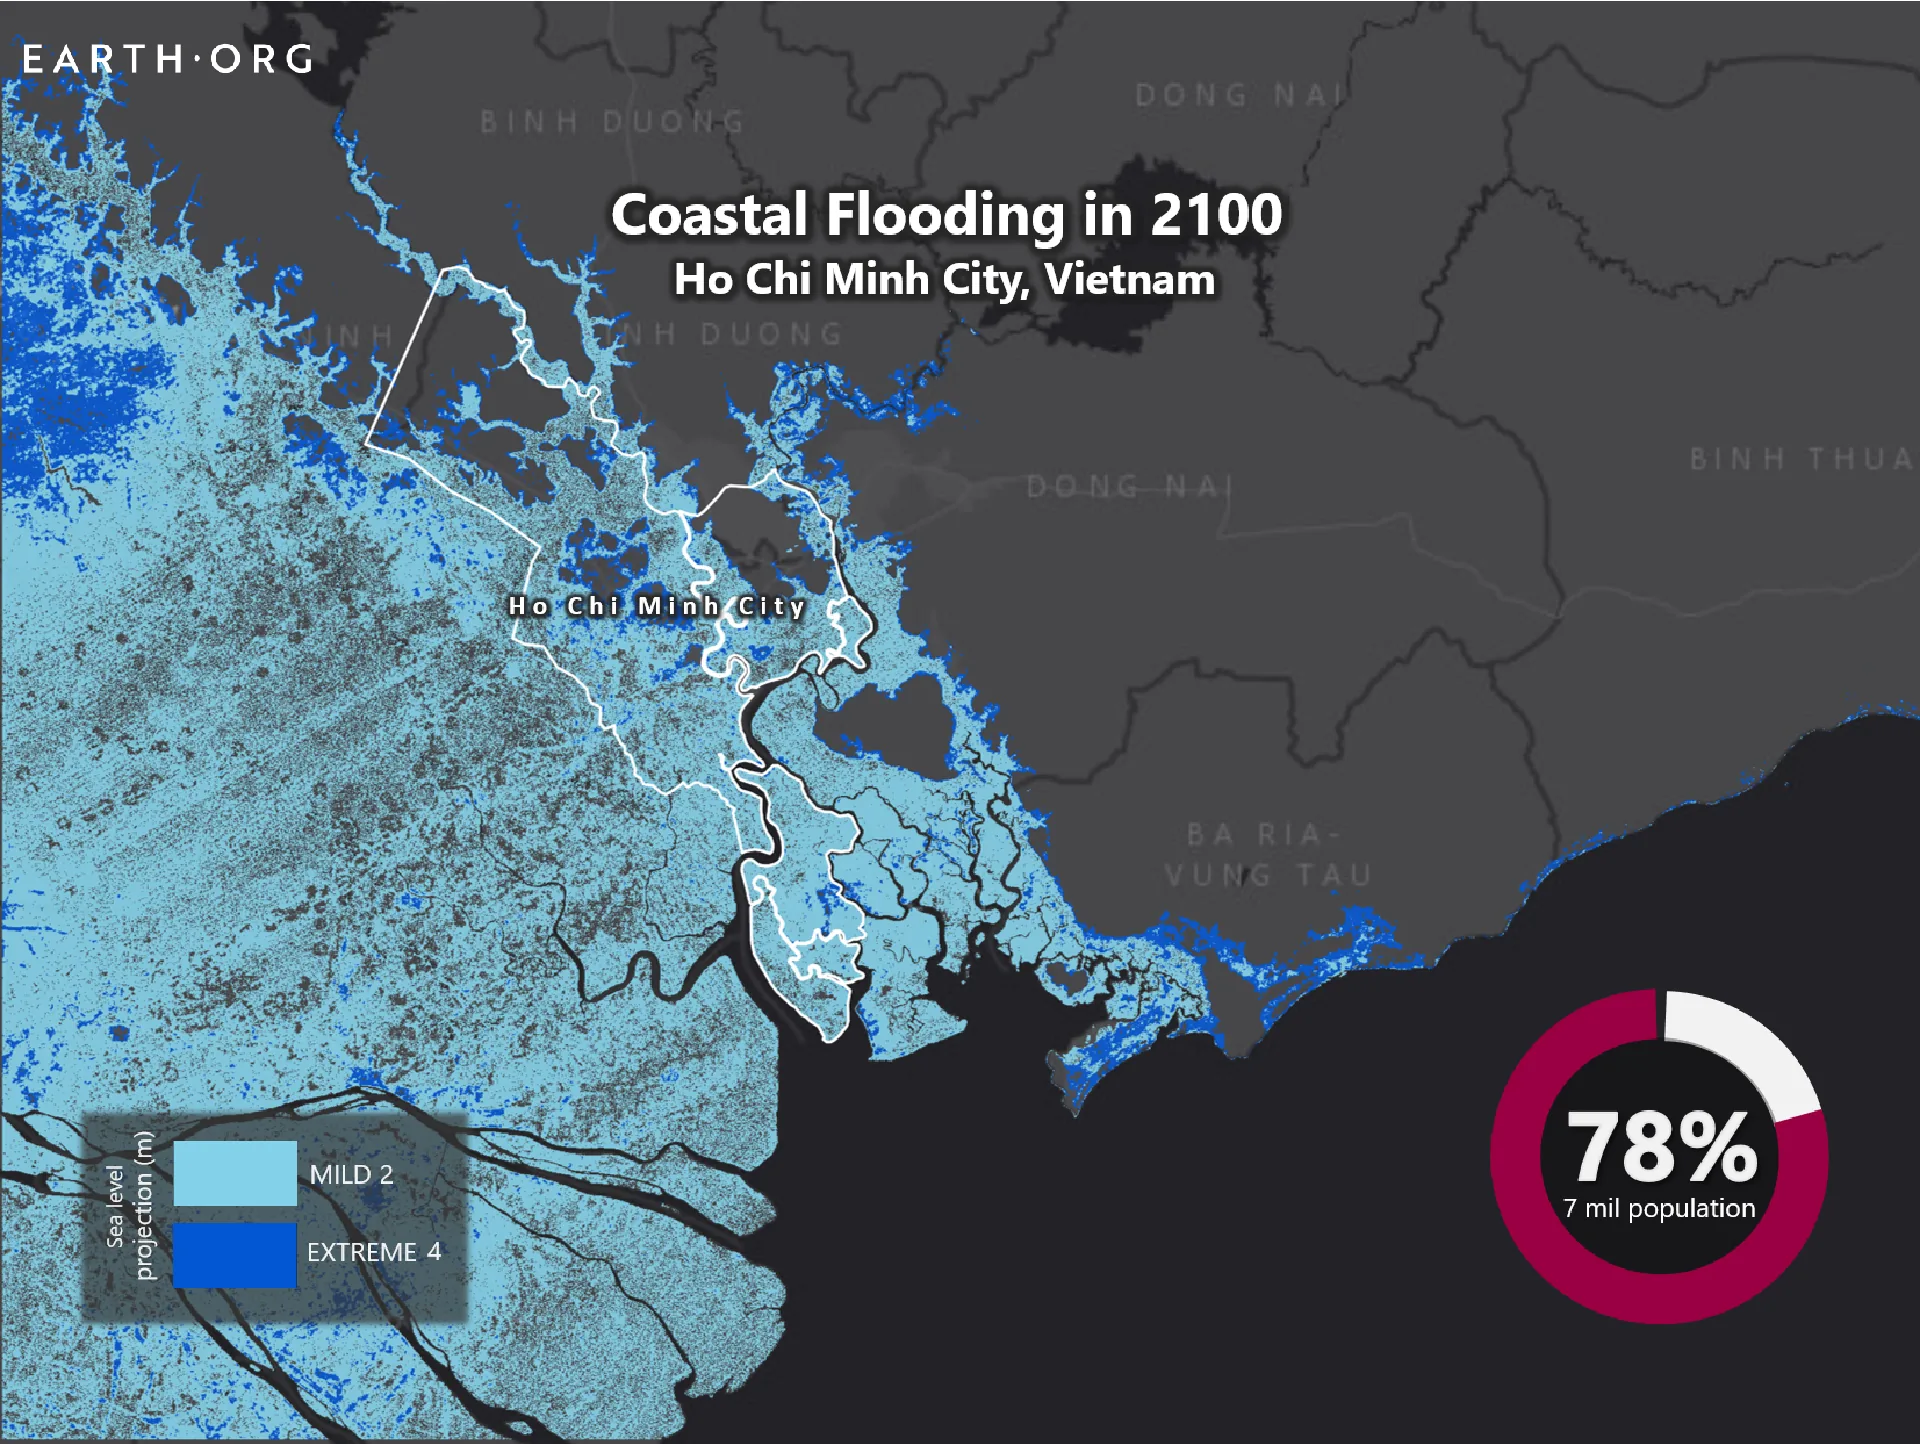
A 72-piece series mapping sea level rise to 2100, city by city, produced in about six weeks in 2020. Built from Climate Central's coastal risk tool and peer-reviewed projections (Kopp et al., Kulp and Strauss, Muis). Its work has been cited in US law reviews and university research.
- Role
- Data Journalism Team Lead
- Scale
- 72 pieces in about six weeks
- Sources
- Climate Central; Kopp et al.; Kulp and Strauss; Muis et al.; GHSL
- Tools
- Python, QGIS, Illustrator
The problem
Sea level rise is usually described in global averages, which are hard to picture. The aim was to make the risk concrete for the public, city by city, so a reader could see what 2100 might look like where they live.
What I did
The series is 72 pieces, one for each city or place, produced in about six weeks in 2020. Each piece follows the same template, which is what made that pace possible.
The flood maps are built with Climate Central's coastal risk tool, and the projections come from peer-reviewed research: Kopp et al. for sea level rise, Muis et al. for storm surge, and Kulp and Strauss for the elevation-based exposure. Population exposure uses Global Human Settlement Layer (GHSL) population data. Each piece is checked against its sources before it is published.
Tools, and how they fit together
Python for the data analysis, QGIS for the geospatial visualisation and Adobe Illustrator for the final production, with a graphic designer producing the final graphics.
Who I worked with
I was Data Journalism Team Lead at Earth.Org (January 2020 to January 2022). The data team was made up of volunteer contributors from around the world, between 5 and 15 people at a time. For every piece I conceptualised it, did the research and directed the number crunching and the final design; a graphic designer handled final production. No developer was involved in the pieces I know of.
Result
The series has been cited in US law reviews and university research (see citations). It was produced without outreach or link-building. The pieces sit on the Earth.Org data visualisation hub.
Limits
City-level projections depend on the underlying elevation data and the warming scenario chosen, and they show exposure, not a forecast of flooding in any given year. The full sources and methods for each city are in the original articles on Earth.Org.