Earth.Org · Dataviz series
Extreme Temperatures, Part III: Canada
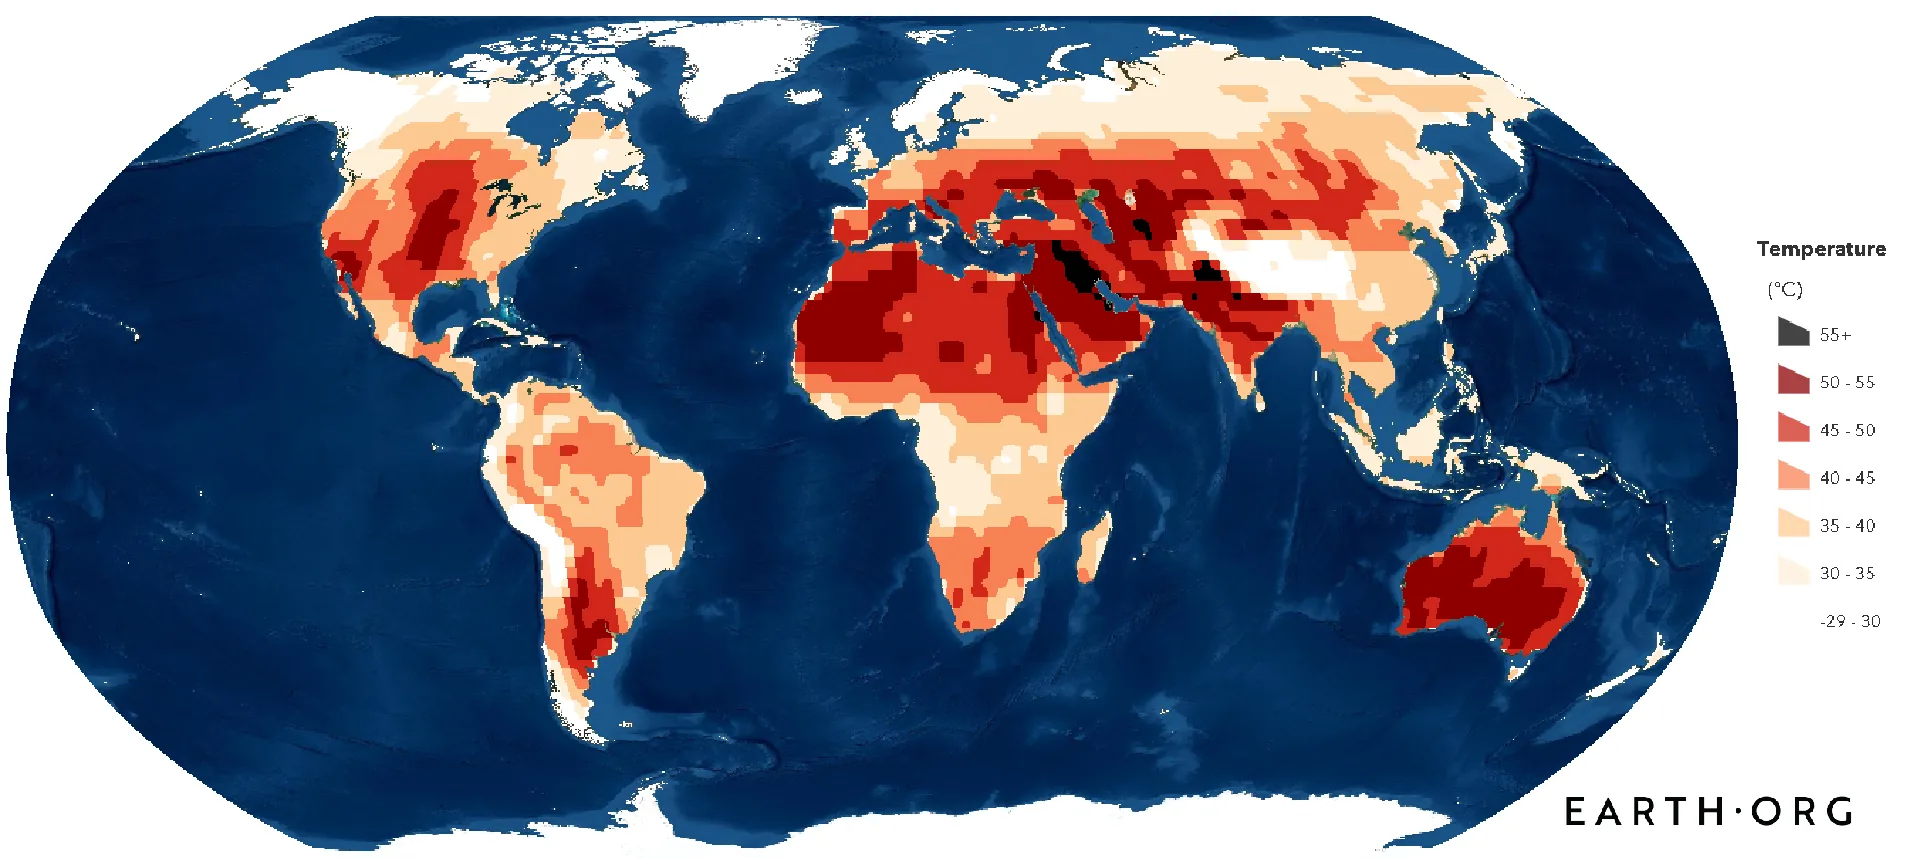
Canola accounts for about a quarter of Canadian crop sales, and its fields sit mostly in the prairie provinces. Under 2°C of warming, 53% of canola fields could see temperatures above 38°C, and 88% under 4°C. The piece also overlays the heat on the boreal forest's wildfire risk areas.
- Published
- Earth.Org, 21 October 2020
- My role
- Data Journalism Team Lead (2020 to 2022)
- Tools
- Python, QGIS and Adobe Illustrator
What it shows
Canola accounts for about a quarter of Canadian crop sales, and its fields sit mostly in the prairie provinces. Under 2°C of warming, 53% of canola fields could see temperatures above 38°C, and 88% under 4°C. The piece also overlays the heat on the boreal forest's wildfire risk areas.
What I did
Data Journalism Team Lead at Earth.Org (January 2020 to January 2022), leading a volunteer data team of between 5 and 15 people. For each piece I conceptualised it, did the research and directed the number crunching and the final design. A graphic designer handled final production. Mapping by Keir Murdo.
Data and methods
Extreme temperature simulations from the MPI-GE (Suarez-Gutierrez et al. 2020), set against the location of Canada's canola fields and the Canadian Forest Fire Weather Index for July.
Full sources are listed in the original article.
Tools
Python, QGIS and Adobe Illustrator.
Who I worked with
Earth.Org's data team was made up of volunteer contributors from around the world, between 5 and 15 people at a time. Mapping by Keir Murdo.
Limits
The simulated peaks are rare extremes, not average conditions, and the projected exposure is a share of mapped area, not a forecast of crop loss in any given year.