Earth.Org · Dataviz series
Extreme Temperatures, Part II: France
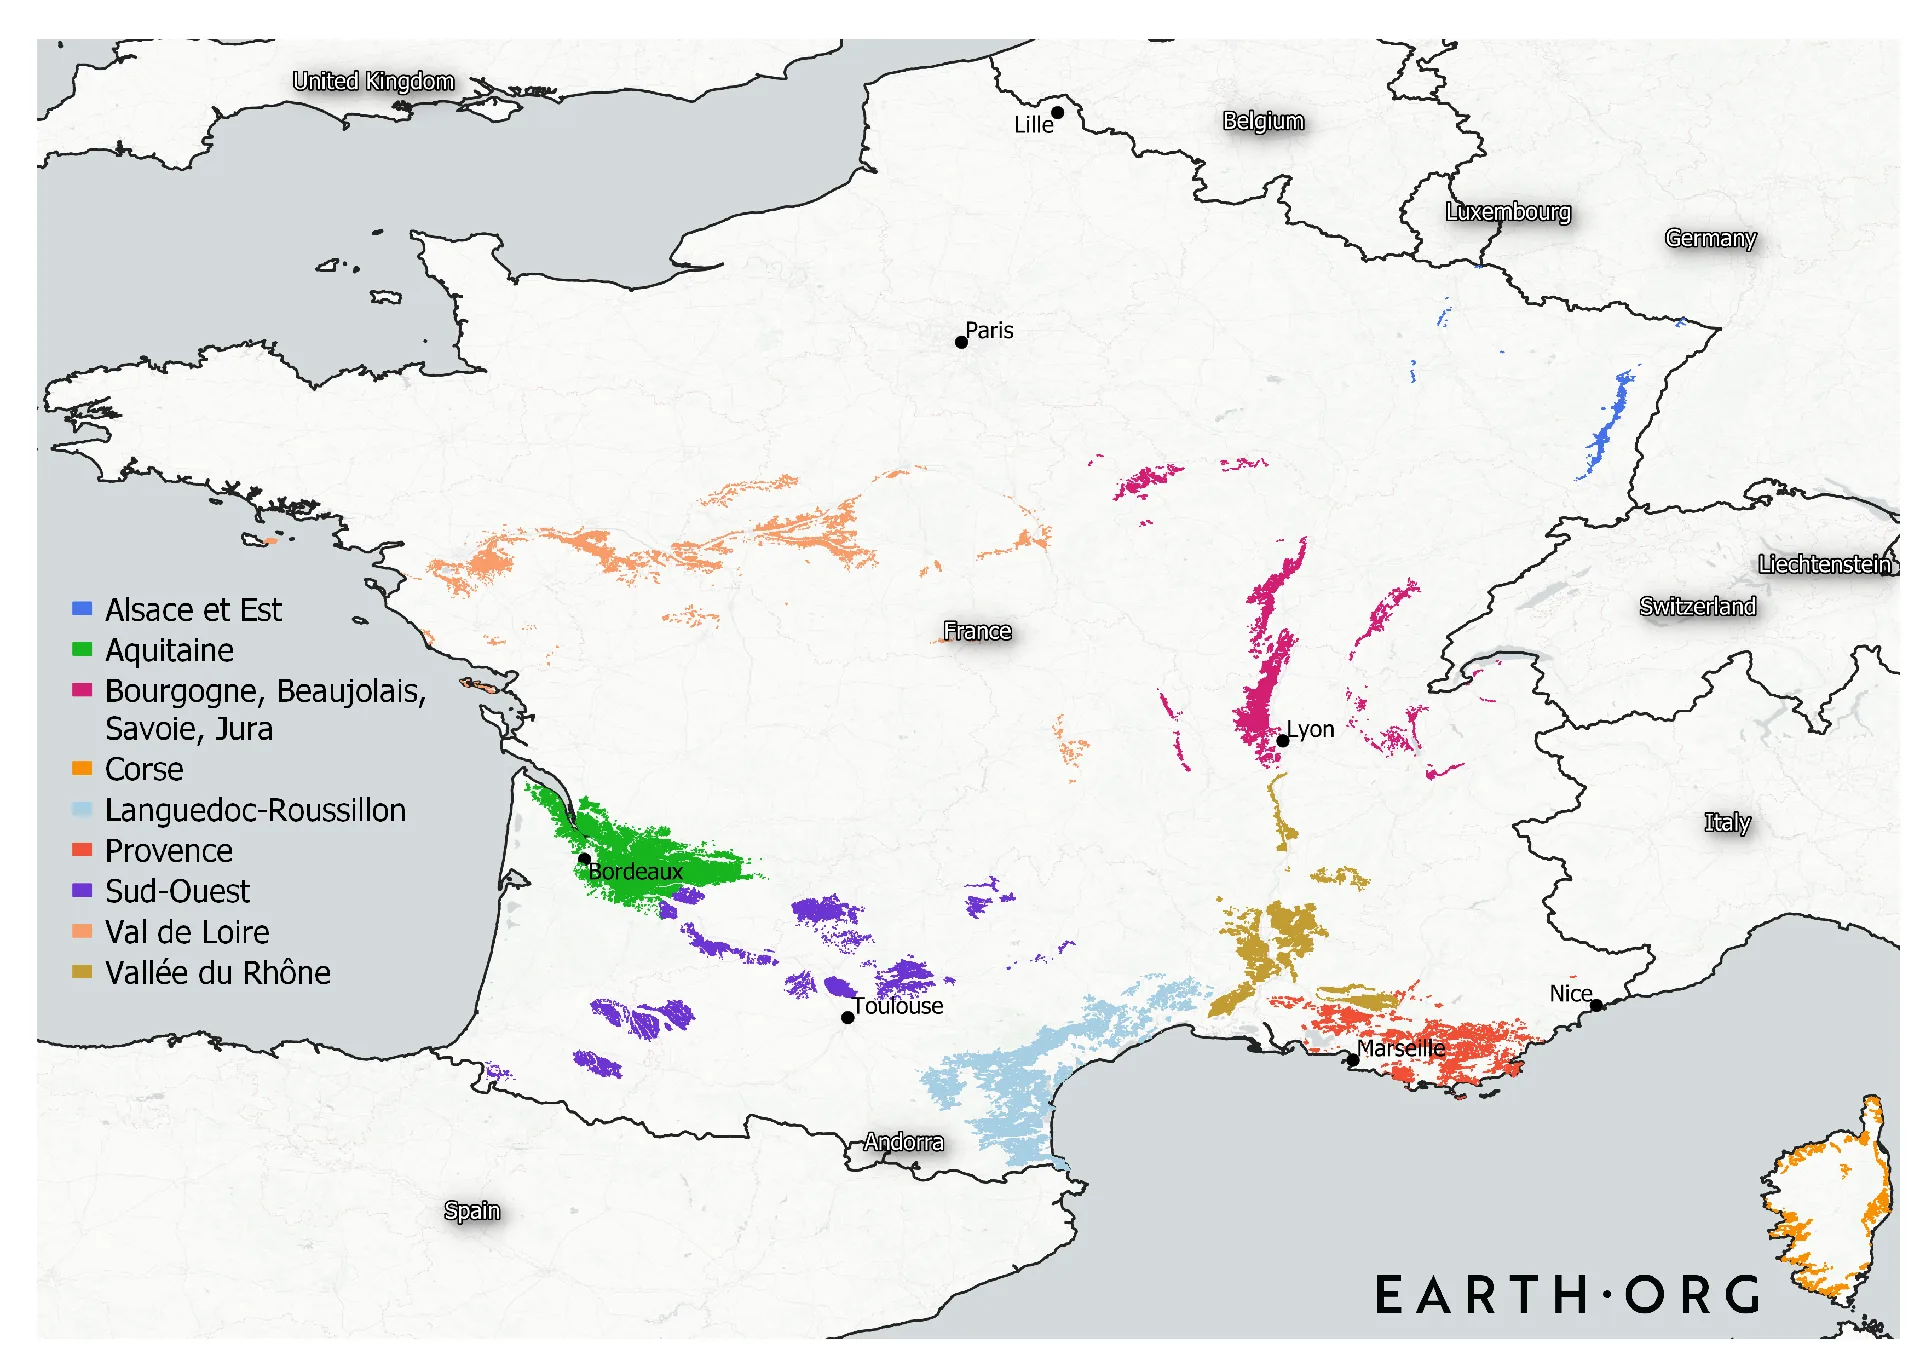
What could the most extreme summer heat mean for French agriculture? Of 3,518 geocoded dairy farms, 28% sit in zones that could pass 38°C under 2°C of warming, rising to 78% under 4°C. The piece also maps 11,200 vineyards against the same heat spikes.
- Published
- Earth.Org, 5 October 2020
- My role
- Data Journalism Team Lead (2020 to 2022)
- Tools
- Python, QGIS and Adobe Illustrator
What it shows
What could the most extreme summer heat mean for French agriculture? Of 3,518 geocoded dairy farms, 28% sit in zones that could pass 38°C under 2°C of warming, rising to 78% under 4°C. The piece also maps 11,200 vineyards against the same heat spikes.
What I did
Data Journalism Team Lead at Earth.Org (January 2020 to January 2022), leading a volunteer data team of between 5 and 15 people. For each piece I conceptualised it, did the research and directed the number crunching and the final design. A graphic designer handled final production. Mapping by Keir Murdo.
Data and methods
Extreme temperature simulations from the MPI-GE (Suarez-Gutierrez et al. 2020), set against French government data on dairy farms and the INAO register of vineyards, with heat-stress thresholds for cattle (Collier et al. 2012) and vine observations from Australia's 2009 heatwave (Webb et al. 2009).
Full sources are listed in the original article.
Tools
Python, QGIS and Adobe Illustrator.
Who I worked with
Earth.Org's data team was made up of volunteer contributors from around the world, between 5 and 15 people at a time. Mapping by Keir Murdo.
Limits
The extreme temperatures could occur anywhere inside the mapped zones but not across them all at once, and the 4°C scenario is presented as a hypothetical illustration. Farmers are likely to adapt as the world warms, which the piece acknowledges.